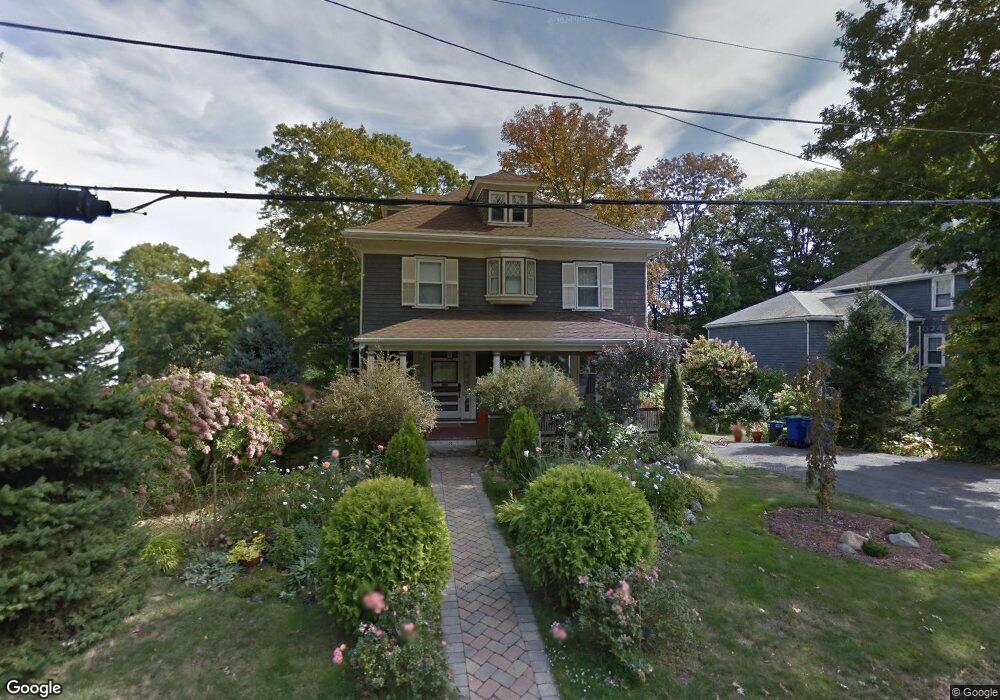
33 Cochato Rd Braintree, MA 02184
North Braintree NeighborhoodEstimated Value: $840,000 - $917,000
4
Beds
2
Baths
2,110
Sq Ft
$417/Sq Ft
Est. Value
About This Home
This home is located at 33 Cochato Rd, Braintree, MA 02184 and is currently estimated at $880,427, approximately $417 per square foot. 33 Cochato Rd is a home located in Norfolk County with nearby schools including Braintree High School, Step Ahead Kindergarten, and Meeting House Montessori School.
Ownership History
Date
Name
Owned For
Owner Type
Purchase Details
Closed on
Sep 15, 2006
Sold by
Howley Alicja M and Howley James P
Bought by
Howley T and Howley Alicja M
Current Estimated Value
Purchase Details
Closed on
May 15, 1997
Sold by
Brodeur Constr Inc
Bought by
Howley James P and Howley Alicia M
Home Financials for this Owner
Home Financials are based on the most recent Mortgage that was taken out on this home.
Original Mortgage
$172,000
Interest Rate
8.12%
Mortgage Type
Purchase Money Mortgage
Purchase Details
Closed on
Apr 7, 1997
Sold by
Pratt Ex Harold I
Bought by
Brodeur Constr Corp
Home Financials for this Owner
Home Financials are based on the most recent Mortgage that was taken out on this home.
Original Mortgage
$172,000
Interest Rate
8.12%
Mortgage Type
Purchase Money Mortgage
Create a Home Valuation Report for This Property
The Home Valuation Report is an in-depth analysis detailing your home's value as well as a comparison with similar homes in the area
Home Values in the Area
Average Home Value in this Area
Purchase History
| Date | Buyer | Sale Price | Title Company |
|---|---|---|---|
| Howley T | -- | -- | |
| Howley James P | $215,000 | -- | |
| Brodeur Constr Corp | $380,000 | -- |
Source: Public Records
Mortgage History
| Date | Status | Borrower | Loan Amount |
|---|---|---|---|
| Previous Owner | Brodeur Constr Corp | $169,200 | |
| Previous Owner | Brodeur Constr Corp | $172,000 | |
| Previous Owner | Brodeur Constr Corp | $304,000 |
Source: Public Records
Tax History
| Year | Tax Paid | Tax Assessment Tax Assessment Total Assessment is a certain percentage of the fair market value that is determined by local assessors to be the total taxable value of land and additions on the property. | Land | Improvement |
|---|---|---|---|---|
| 2025 | $7,990 | $800,600 | $340,900 | $459,700 |
| 2024 | $7,240 | $763,700 | $319,600 | $444,100 |
| 2023 | $6,924 | $709,400 | $289,700 | $419,700 |
| 2022 | $6,720 | $675,400 | $255,700 | $419,700 |
| 2021 | $6,477 | $651,000 | $255,700 | $395,300 |
| 2020 | $6,116 | $620,300 | $225,000 | $395,300 |
| 2019 | $5,823 | $577,100 | $225,000 | $352,100 |
| 2018 | $5,532 | $524,900 | $187,500 | $337,400 |
| 2017 | $5,480 | $510,200 | $187,500 | $322,700 |
| 2016 | $5,200 | $473,600 | $170,400 | $303,200 |
| 2015 | $5,080 | $458,900 | $167,900 | $291,000 |
| 2014 | $4,814 | $421,500 | $152,500 | $269,000 |
Source: Public Records
Map
Nearby Homes
- 491 Washington St Unit 1
- 469-471 Washington St
- 87 Walnut St
- 6 Oak St
- 63 Dickerman Ln
- 30 Church St Unit 4
- 29 Joseph Rd
- 20 Vine St
- 5 Woodsum Dr Unit 12
- 50 Cleveland Ave
- 36 Chestnut Ave
- 342 Elm St
- 255 River St
- 17 White Rd
- 9 Independence Ave Unit 307
- 15 Calvin St
- 7 Del's Way
- 20 Blossom Rd
- 47 Addison St
- 192 Federal Ave Unit B
Your Personal Tour Guide
Ask me questions while you tour the home.