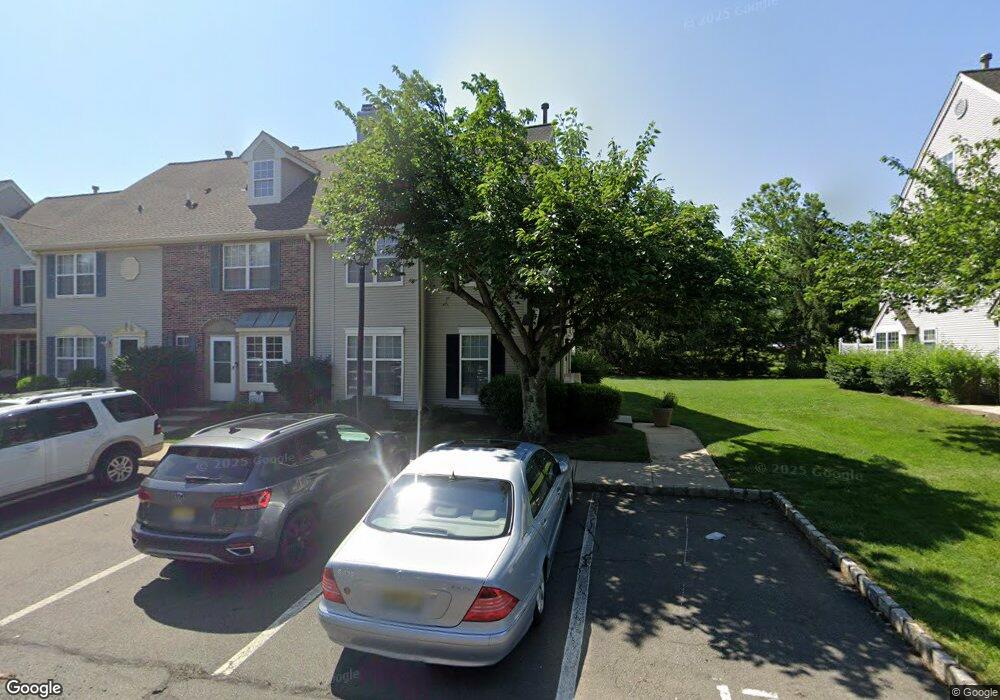
33 Colleen Ct Kendall Park, NJ 08824
Estimated Value: $473,754 - $540,000
3
Beds
3
Baths
1,804
Sq Ft
$281/Sq Ft
Est. Value
About This Home
This home is located at 33 Colleen Ct, Kendall Park, NJ 08824 and is currently estimated at $507,689, approximately $281 per square foot. 33 Colleen Ct is a home located in Middlesex County with nearby schools including Brunswick Acres Elementary School, Crossroads South Middle School, and South Brunswick High School.
Ownership History
Date
Name
Owned For
Owner Type
Purchase Details
Closed on
Mar 30, 2022
Sold by
Doryumu Casely
Bought by
Doryumu Casely and Doryumu Audrey H
Current Estimated Value
Home Financials for this Owner
Home Financials are based on the most recent Mortgage that was taken out on this home.
Original Mortgage
$155,000
Interest Rate
3.76%
Mortgage Type
New Conventional
Purchase Details
Closed on
Nov 9, 2016
Sold by
Doryumu Audrey
Bought by
Doryumu Casely
Purchase Details
Closed on
Oct 27, 2003
Sold by
Niamkey Hollanme
Bought by
Doryumu Audrey and Doryumu Casely
Home Financials for this Owner
Home Financials are based on the most recent Mortgage that was taken out on this home.
Original Mortgage
$199,000
Interest Rate
5.94%
Purchase Details
Closed on
Dec 26, 2000
Sold by
Principe Richard
Bought by
Niamkey Hollanme and Niamkey Dorothy
Home Financials for this Owner
Home Financials are based on the most recent Mortgage that was taken out on this home.
Original Mortgage
$166,500
Interest Rate
7.69%
Purchase Details
Closed on
Aug 13, 1999
Sold by
Mongelli Richard
Bought by
Principe Richard and Principe Patricia Palm
Home Financials for this Owner
Home Financials are based on the most recent Mortgage that was taken out on this home.
Original Mortgage
$114,300
Interest Rate
7.83%
Create a Home Valuation Report for This Property
The Home Valuation Report is an in-depth analysis detailing your home's value as well as a comparison with similar homes in the area
Home Values in the Area
Average Home Value in this Area
Purchase History
| Date | Buyer | Sale Price | Title Company |
|---|---|---|---|
| Doryumu Casely | -- | Amrock | |
| Doryumu Casely | -- | Amrock | |
| Doryumu Casely | -- | None Available | |
| Doryumu Audrey | $225,000 | -- | |
| Niamkey Hollanme | $185,000 | -- | |
| Principe Richard | $127,000 | -- |
Source: Public Records
Mortgage History
| Date | Status | Borrower | Loan Amount |
|---|---|---|---|
| Previous Owner | Doryumu Casely | $155,000 | |
| Previous Owner | Doryumu Audrey | $199,000 | |
| Previous Owner | Niamkey Hollanme | $166,500 | |
| Previous Owner | Principe Richard | $114,300 |
Source: Public Records
Tax History Compared to Growth
Tax History
| Year | Tax Paid | Tax Assessment Tax Assessment Total Assessment is a certain percentage of the fair market value that is determined by local assessors to be the total taxable value of land and additions on the property. | Land | Improvement |
|---|---|---|---|---|
| 2025 | $7,243 | $133,000 | $50,000 | $83,000 |
| 2024 | $6,983 | $133,000 | $50,000 | $83,000 |
| 2023 | $6,983 | $133,000 | $50,000 | $83,000 |
| 2022 | $6,778 | $133,000 | $50,000 | $83,000 |
| 2021 | $5,213 | $133,000 | $50,000 | $83,000 |
| 2020 | $6,815 | $133,000 | $50,000 | $83,000 |
| 2019 | $6,875 | $133,000 | $50,000 | $83,000 |
| 2018 | $6,650 | $133,000 | $50,000 | $83,000 |
| 2017 | $6,639 | $133,000 | $50,000 | $83,000 |
| 2016 | $6,569 | $133,000 | $50,000 | $83,000 |
| 2015 | $6,369 | $133,000 | $50,000 | $83,000 |
| 2014 | $6,267 | $133,000 | $50,000 | $83,000 |
Source: Public Records
Map
Nearby Homes