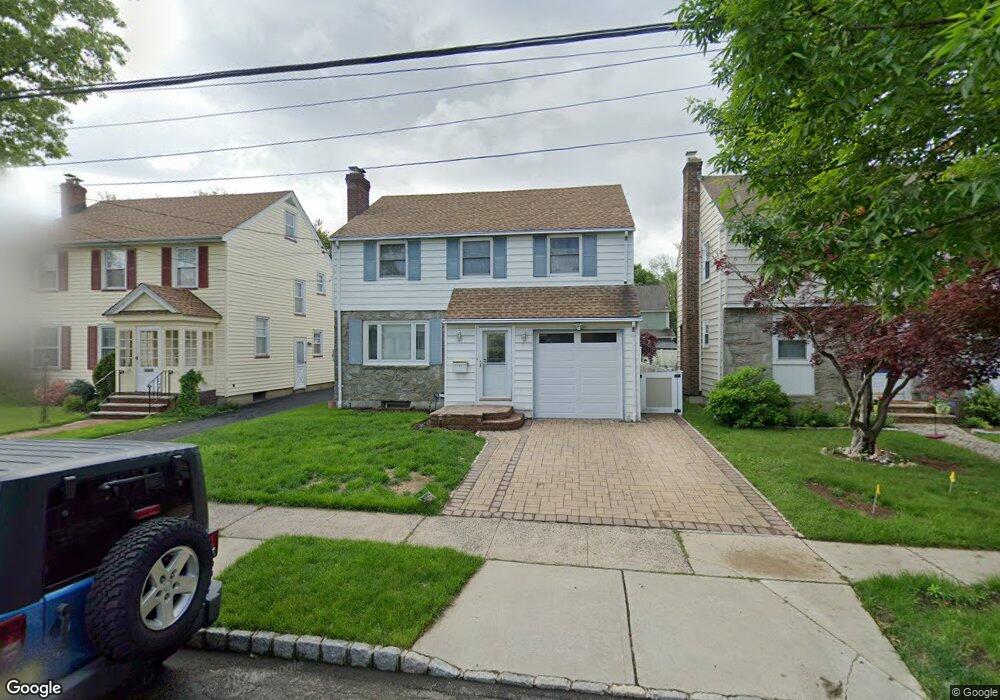
33 Collins Ave Bloomfield, NJ 07003
Estimated Value: $629,338 - $809,000
--
Bed
--
Bath
1,504
Sq Ft
$456/Sq Ft
Est. Value
About This Home
This home is located at 33 Collins Ave, Bloomfield, NJ 07003 and is currently estimated at $686,335, approximately $456 per square foot. 33 Collins Ave is a home located in Essex County with nearby schools including Oak View School, Bloomfield Middle School, and Bloomfield High School.
Ownership History
Date
Name
Owned For
Owner Type
Purchase Details
Closed on
Apr 30, 1997
Sold by
Salvation Army
Bought by
Mollica Kevin and Mollica Diana
Current Estimated Value
Home Financials for this Owner
Home Financials are based on the most recent Mortgage that was taken out on this home.
Original Mortgage
$153,000
Outstanding Balance
$20,919
Interest Rate
7.98%
Mortgage Type
VA
Estimated Equity
$665,416
Create a Home Valuation Report for This Property
The Home Valuation Report is an in-depth analysis detailing your home's value as well as a comparison with similar homes in the area
Home Values in the Area
Average Home Value in this Area
Purchase History
| Date | Buyer | Sale Price | Title Company |
|---|---|---|---|
| Mollica Kevin | $150,000 | -- |
Source: Public Records
Mortgage History
| Date | Status | Borrower | Loan Amount |
|---|---|---|---|
| Open | Mollica Kevin | $153,000 |
Source: Public Records
Tax History Compared to Growth
Tax History
| Year | Tax Paid | Tax Assessment Tax Assessment Total Assessment is a certain percentage of the fair market value that is determined by local assessors to be the total taxable value of land and additions on the property. | Land | Improvement |
|---|---|---|---|---|
| 2025 | $13,167 | $402,900 | $195,400 | $207,500 |
| 2024 | $13,167 | $402,900 | $195,400 | $207,500 |
| 2022 | $12,901 | $402,900 | $195,400 | $207,500 |
| 2021 | $12,663 | $402,900 | $195,400 | $207,500 |
| 2020 | $12,470 | $402,900 | $195,400 | $207,500 |
| 2019 | $13,344 | $335,200 | $179,000 | $156,200 |
| 2018 | $13,287 | $335,200 | $179,000 | $156,200 |
| 2017 | $13,086 | $335,200 | $179,000 | $156,200 |
| 2016 | $12,939 | $335,200 | $179,000 | $156,200 |
| 2015 | $12,821 | $335,200 | $179,000 | $156,200 |
| 2014 | $12,587 | $335,200 | $179,000 | $156,200 |
Source: Public Records
Map
Nearby Homes
- 45 Collins Ave
- 65 Ernst Ave
- 96 W Passaic Ave
- 198 W Passaic Ave
- 14 Chestnut Terrace
- 33 Irwin Place
- 101 Bryant Ave
- 42 Meadow Ln
- 36 Alyson Place
- 32 Hyde Rd
- 2 Perry Rd
- 15 Andover Place
- 44 George St
- 57 Yale St
- 40 Bryant Ave
- 18 Farmingdale Ave
- 1552 Broad St Rear
- 41 Bryant Ave
- 92 Mountain Ave
- 355 W Passaic Ave