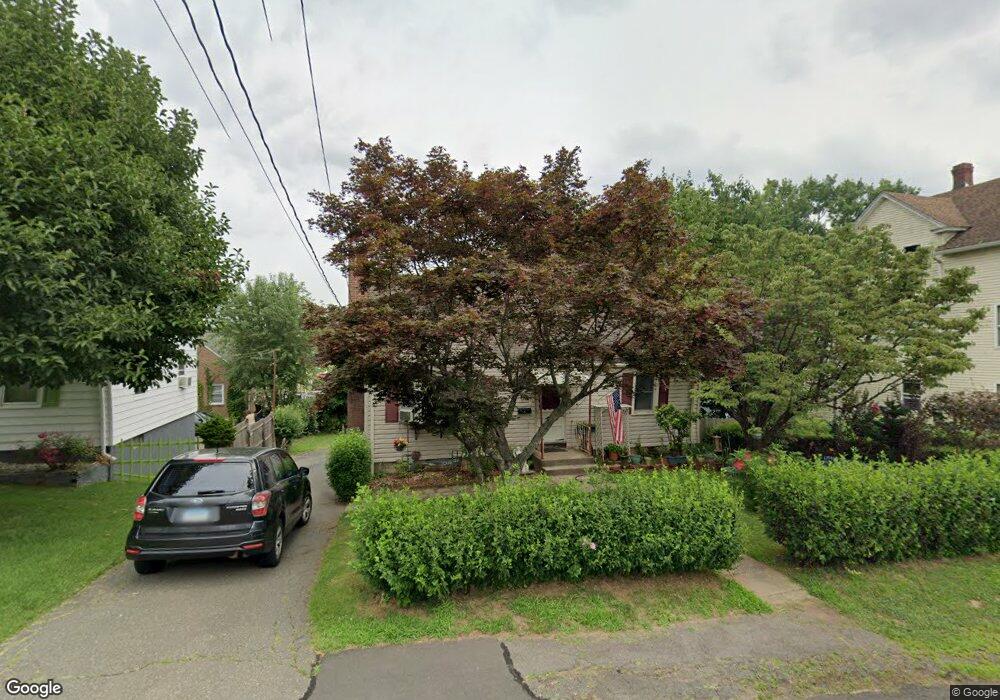
33 Collins St New Britain, CT 06051
Estimated Value: $263,664 - $330,000
3
Beds
1
Bath
1,224
Sq Ft
$241/Sq Ft
Est. Value
About This Home
This home is located at 33 Collins St, New Britain, CT 06051 and is currently estimated at $294,916, approximately $240 per square foot. 33 Collins St is a home located in Hartford County with nearby schools including Slade Middle School, Raymond Hill School, and Mountain Laurel Sudbury School.
Ownership History
Date
Name
Owned For
Owner Type
Purchase Details
Closed on
Feb 19, 2013
Sold by
Garafino Sabina
Bought by
Bac Home Loan Svcng
Current Estimated Value
Home Financials for this Owner
Home Financials are based on the most recent Mortgage that was taken out on this home.
Original Mortgage
$135,799
Interest Rate
3.58%
Mortgage Type
Stand Alone Refi Refinance Of Original Loan
Purchase Details
Closed on
Nov 28, 2005
Sold by
Picard Shirley A
Bought by
Acosta Julio and Ubides Jose
Purchase Details
Closed on
Nov 1, 1995
Sold by
Mary Jordan Trust
Bought by
Murphy George
Create a Home Valuation Report for This Property
The Home Valuation Report is an in-depth analysis detailing your home's value as well as a comparison with similar homes in the area
Home Values in the Area
Average Home Value in this Area
Purchase History
| Date | Buyer | Sale Price | Title Company |
|---|---|---|---|
| Bac Home Loan Svcng | -- | -- | |
| Acosta Julio | $165,000 | -- | |
| Murphy George | $92,750 | -- |
Source: Public Records
Mortgage History
| Date | Status | Borrower | Loan Amount |
|---|---|---|---|
| Open | Murphy George | $124,227 | |
| Closed | Murphy George | $135,799 |
Source: Public Records
Tax History Compared to Growth
Tax History
| Year | Tax Paid | Tax Assessment Tax Assessment Total Assessment is a certain percentage of the fair market value that is determined by local assessors to be the total taxable value of land and additions on the property. | Land | Improvement |
|---|---|---|---|---|
| 2025 | $5,197 | $132,650 | $40,250 | $92,400 |
| 2024 | $5,252 | $132,650 | $40,250 | $92,400 |
| 2023 | $5,078 | $132,650 | $40,250 | $92,400 |
| 2022 | $4,532 | $91,560 | $18,550 | $73,010 |
| 2021 | $4,532 | $91,560 | $18,550 | $73,010 |
| 2020 | $4,624 | $91,560 | $18,550 | $73,010 |
| 2019 | $4,624 | $91,560 | $18,550 | $73,010 |
| 2018 | $4,624 | $91,560 | $18,550 | $73,010 |
| 2017 | $4,200 | $83,160 | $18,550 | $64,610 |
| 2016 | $4,200 | $83,160 | $18,550 | $64,610 |
| 2015 | $4,075 | $83,160 | $18,550 | $64,610 |
| 2014 | $4,075 | $83,160 | $18,550 | $64,610 |
Source: Public Records
Map
Nearby Homes