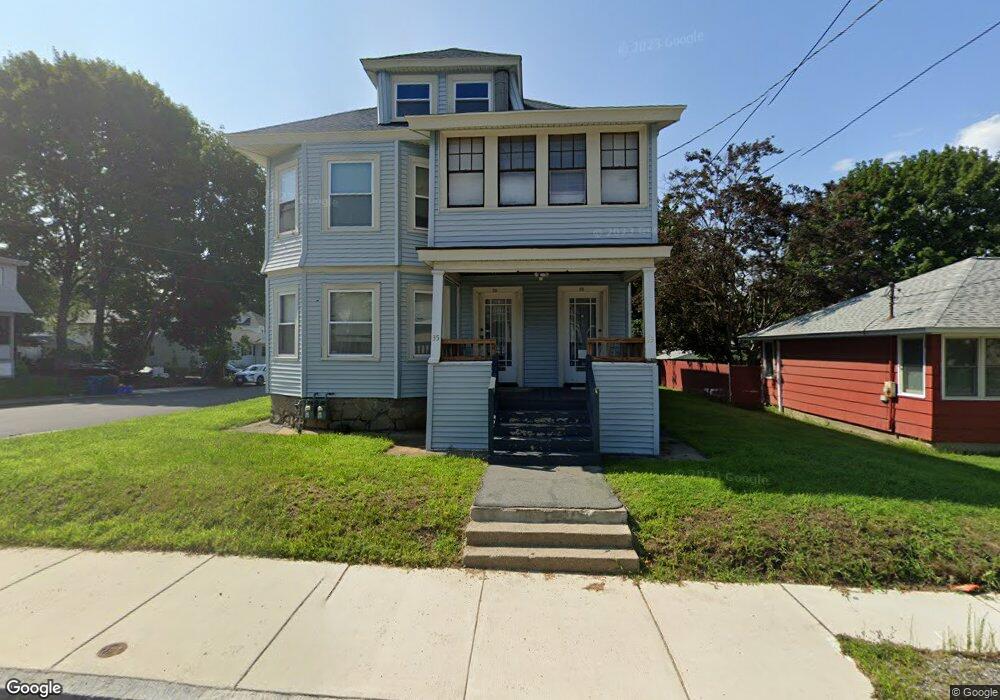
33 Coolidge St Unit 35 Lawrence, MA 01843
South West NeighborhoodEstimated Value: $674,228 - $855,000
6
Beds
2
Baths
2,848
Sq Ft
$272/Sq Ft
Est. Value
About This Home
This home is located at 33 Coolidge St Unit 35, Lawrence, MA 01843 and is currently estimated at $776,057, approximately $272 per square foot. 33 Coolidge St Unit 35 is a home located in Essex County with nearby schools including John Breen School, Emily G. Wetherbee School (K-8), and School For Exceptional Studies.
Ownership History
Date
Name
Owned For
Owner Type
Purchase Details
Closed on
May 14, 2021
Sold by
Deluca Paul S and Deluca Maribel
Bought by
Coolcrest T
Current Estimated Value
Purchase Details
Closed on
Aug 2, 1999
Sold by
Diep Quang Chi and Diep Tran Luu
Bought by
Deluca Paul S and Deluca Maribel
Home Financials for this Owner
Home Financials are based on the most recent Mortgage that was taken out on this home.
Original Mortgage
$129,199
Interest Rate
7.61%
Mortgage Type
Purchase Money Mortgage
Purchase Details
Closed on
Nov 15, 1988
Sold by
Holak Susan M
Bought by
Chi Diep Quang
Home Financials for this Owner
Home Financials are based on the most recent Mortgage that was taken out on this home.
Original Mortgage
$132,000
Interest Rate
10.36%
Mortgage Type
Purchase Money Mortgage
Create a Home Valuation Report for This Property
The Home Valuation Report is an in-depth analysis detailing your home's value as well as a comparison with similar homes in the area
Home Values in the Area
Average Home Value in this Area
Purchase History
| Date | Buyer | Sale Price | Title Company |
|---|---|---|---|
| Coolcrest T | -- | None Available | |
| Deluca Paul S | $129,900 | -- | |
| Chi Diep Quang | $165,000 | -- |
Source: Public Records
Mortgage History
| Date | Status | Borrower | Loan Amount |
|---|---|---|---|
| Previous Owner | Chi Diep Quang | $142,353 | |
| Previous Owner | Chi Diep Quang | $129,199 | |
| Previous Owner | Chi Diep Quang | $132,000 |
Source: Public Records
Tax History
| Year | Tax Paid | Tax Assessment Tax Assessment Total Assessment is a certain percentage of the fair market value that is determined by local assessors to be the total taxable value of land and additions on the property. | Land | Improvement |
|---|---|---|---|---|
| 2025 | $5,880 | $668,200 | $154,200 | $514,000 |
| 2024 | $5,488 | $593,300 | $122,500 | $470,800 |
| 2023 | $5,563 | $547,500 | $122,500 | $425,000 |
| 2022 | $5,113 | $446,900 | $121,700 | $325,200 |
| 2021 | $4,996 | $407,200 | $119,900 | $287,300 |
| 2020 | $4,704 | $378,400 | $105,400 | $273,000 |
| 2019 | $4,720 | $345,000 | $89,000 | $256,000 |
| 2018 | $4,121 | $287,800 | $84,900 | $202,900 |
| 2017 | $4,044 | $263,600 | $80,000 | $183,600 |
| 2016 | $3,837 | $247,400 | $68,400 | $179,000 |
| 2015 | $3,689 | $244,000 | $68,400 | $175,600 |
Source: Public Records
Map
Nearby Homes
- 33-35 Coolidge St
- 91-93 Newton St
- 543 Andover St Unit 6
- 37 Tewksbury St Unit 39
- 49 Bowdoin St Unit 51
- 312 Water St Unit 4
- 18 Doyle St
- 82 S Broadway
- 11 W Hawley St
- 87-87A Brookfield St
- 82 Water St
- 19 Oregon Ave
- 24 Inman St Unit 4
- 341 S Broadway- Parcel II
- 31 Garfield St
- 35 Adams St
- 100 Bailey St Unit 1
- 100 Bailey St Unit 3
- 1008 Essex St Unit 1010
- 27-29 Dorchester St
- 29 Coolidge St
- 160 Carleton St
- 23 Coolidge St Unit 25
- 23-25 Coolidge St
- 41 Coolidge St Unit 43
- 28 Coolidge St Unit 30
- 14 Dana St
- 34 Coolidge St
- 28-30 Coolidge St
- 19-21 Coolidge St
- 19 Coolidge St Unit 21
- 16 Coolidge St Unit 18
- 22 Coolidge St Unit 24
- 38 Coolidge St Unit 40
- 47 Coolidge St Unit 49
- 20A Dana St Unit A
- 10 Dana St Unit 12
- 17 Coolidge St
- 8 Coolidge St Unit 10
- 15-17 Coolidge St
Your Personal Tour Guide
Ask me questions while you tour the home.