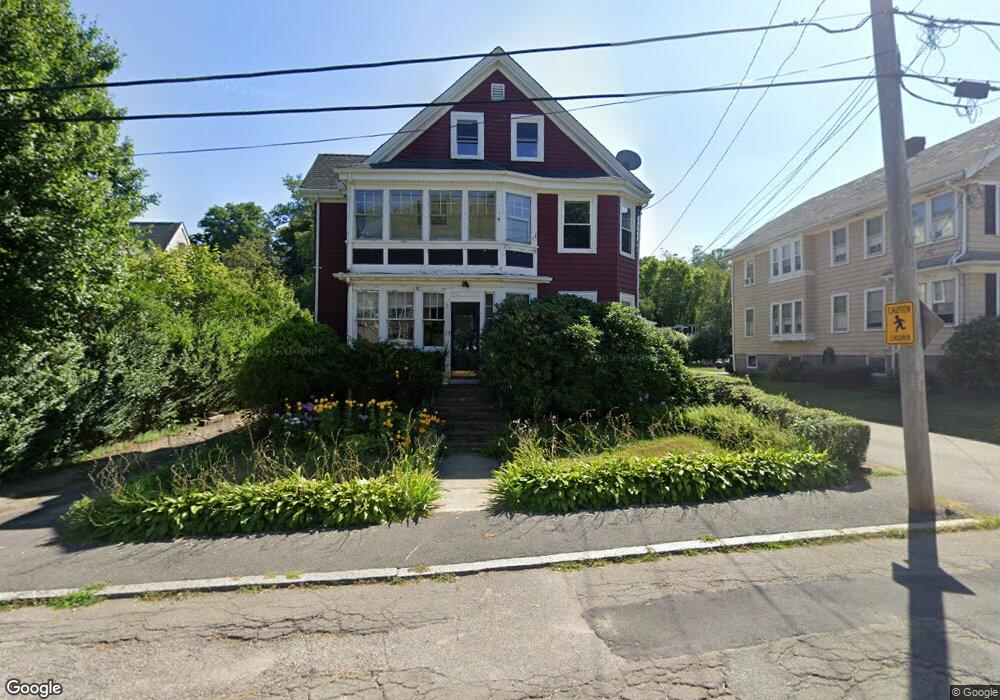
33 Cranch St Unit 2169 Quincy, MA 02169
Quincy Center NeighborhoodEstimated Value: $1,007,000 - $1,216,000
1
Bed
1
Bath
650
Sq Ft
$1,768/Sq Ft
Est. Value
About This Home
This home is located at 33 Cranch St Unit 2169, Quincy, MA 02169 and is currently estimated at $1,149,200, approximately $1,768 per square foot. 33 Cranch St Unit 2169 is a home located in Norfolk County with nearby schools including Charles A. Bernazzani Elementary School, Central Middle School, and Quincy High School.
Ownership History
Date
Name
Owned For
Owner Type
Purchase Details
Closed on
Dec 28, 2012
Sold by
Fennelly Lawrence and Fennelly Annmarie T
Bought by
Walkowiak Agnieszka
Current Estimated Value
Home Financials for this Owner
Home Financials are based on the most recent Mortgage that was taken out on this home.
Original Mortgage
$428,000
Outstanding Balance
$290,283
Interest Rate
3.38%
Mortgage Type
New Conventional
Estimated Equity
$858,917
Purchase Details
Closed on
Mar 31, 2005
Sold by
Fennelly Janet and Fennelly William M
Bought by
Fennelly Annmarie and Fennelly Lawrence
Home Financials for this Owner
Home Financials are based on the most recent Mortgage that was taken out on this home.
Original Mortgage
$253,000
Interest Rate
5.61%
Mortgage Type
Purchase Money Mortgage
Purchase Details
Closed on
Jul 18, 1997
Sold by
Lovendale Carl and Lovendale Carl B
Bought by
Fennelly Lawrence and Fennelly Annmarie
Create a Home Valuation Report for This Property
The Home Valuation Report is an in-depth analysis detailing your home's value as well as a comparison with similar homes in the area
Home Values in the Area
Average Home Value in this Area
Purchase History
| Date | Buyer | Sale Price | Title Company |
|---|---|---|---|
| Walkowiak Agnieszka | $535,000 | -- | |
| Walkowiak Agnieszka | $535,000 | -- | |
| Fennelly Annmarie | -- | -- | |
| Fennelly Annmarie T | -- | -- | |
| Fennelly Lawrence | $185,000 | -- | |
| Fennelly Lawrence J | $185,000 | -- |
Source: Public Records
Mortgage History
| Date | Status | Borrower | Loan Amount |
|---|---|---|---|
| Open | Walkowiak Agnieszka | $428,000 | |
| Closed | Fennelly Lawrence J | $428,000 | |
| Previous Owner | Fennelly Annmarie T | $253,000 | |
| Previous Owner | Fennelly Lawrence J | $227,500 |
Source: Public Records
Tax History
| Year | Tax Paid | Tax Assessment Tax Assessment Total Assessment is a certain percentage of the fair market value that is determined by local assessors to be the total taxable value of land and additions on the property. | Land | Improvement |
|---|---|---|---|---|
| 2025 | $10,985 | $952,700 | $318,700 | $634,000 |
| 2024 | $10,445 | $926,800 | $304,100 | $622,700 |
| 2023 | $9,550 | $858,000 | $277,500 | $580,500 |
| 2022 | $9,536 | $796,000 | $253,300 | $542,700 |
| 2021 | $9,525 | $784,600 | $253,300 | $531,300 |
| 2020 | $7,934 | $638,300 | $241,700 | $396,600 |
| 2019 | $7,848 | $625,300 | $228,700 | $396,600 |
| 2018 | $7,061 | $529,300 | $228,700 | $300,600 |
| 2017 | $7,179 | $506,600 | $218,400 | $288,200 |
| 2016 | $6,706 | $467,000 | $208,500 | $258,500 |
| 2015 | $6,713 | $459,800 | $208,500 | $251,300 |
| 2014 | $6,136 | $412,900 | $199,100 | $213,800 |
Source: Public Records
Map
Nearby Homes
- 165 Whitwell St
- 43 Dixwell Ave
- 195 Thomas Burgin Pkwy Unit 301
- 312 Adams St
- 14 Presidents Ln Unit 10
- 18 Cliveden St Unit 201W
- 18 Johnson Ave Unit 3
- 20 Whitney Rd Unit 1
- 2 Cliveden St Unit 601E
- 2 Cliveden St Unit 405E
- 8 Jackson St Unit B1
- 8 Jackson St Unit B4
- 999 Hancock St Unit 502
- 211 Copeland St
- 10 Edgemere Rd
- 59 Spear St Unit 301
- 44 Elm St
- 11 Pearl St
- 33 Elm St
- 66 Mcgrath Hwy Unit 502
- 33 Cranch St
- 29 1/2 Cranch St
- 20 Rockview Rd Unit 4
- 20 Rockview Rd Unit 3
- 20 Rockview Rd Unit 2
- 20 Rockview Rd Unit 1
- 16 Rockview Rd
- 41 Cranch St
- 37 Cranch St
- 27 Cranch St Unit 29
- 23 Cranch St Unit 3
- 23 Cranch St
- 45 Cranch St
- 49 Cranch St
- 9 Rockview Rd
- 30 Cranch St
- 51 Cranch St
- 34 Cranch St
- 26 Cranch St
- 25 Rockview Rd Unit D
Your Personal Tour Guide
Ask me questions while you tour the home.