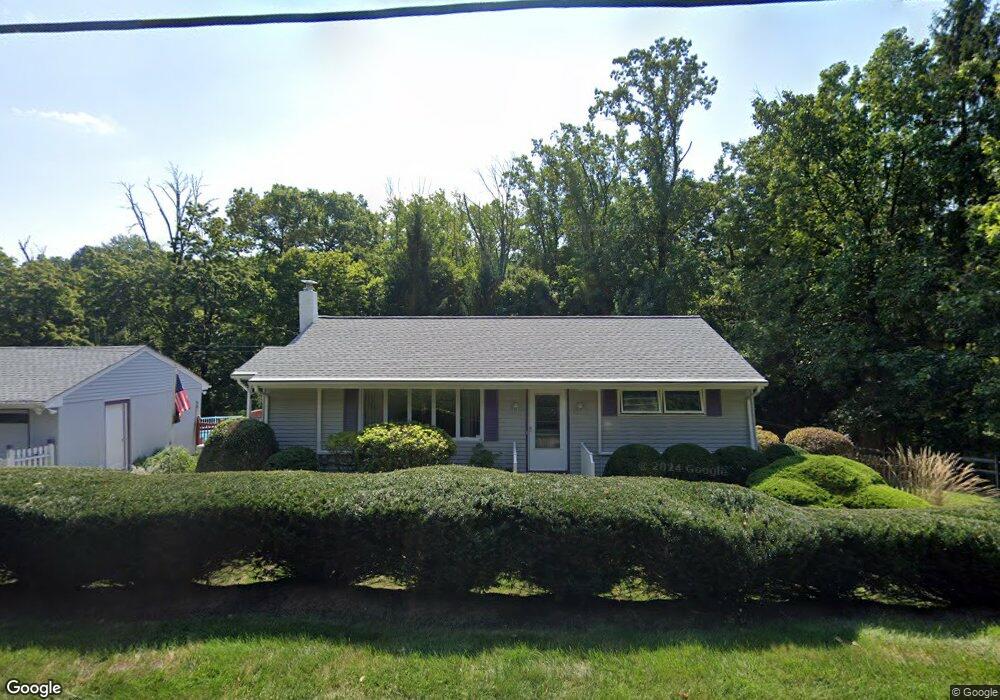
33 Cregar Rd High Bridge, NJ 08829
Estimated Value: $377,572 - $412,000
Studio
--
Bath
1,008
Sq Ft
$390/Sq Ft
Est. Value
About This Home
This home is located at 33 Cregar Rd, High Bridge, NJ 08829 and is currently estimated at $393,393, approximately $390 per square foot. 33 Cregar Rd is a home located in Hunterdon County with nearby schools including High Bridge Elementary School, High Bridge Middle School, and Voorhees High School.
Ownership History
Date
Name
Owned For
Owner Type
Purchase Details
Closed on
Nov 29, 1999
Sold by
Reeves Marc J
Bought by
Sorge Felix
Current Estimated Value
Home Financials for this Owner
Home Financials are based on the most recent Mortgage that was taken out on this home.
Original Mortgage
$156,750
Outstanding Balance
$49,218
Interest Rate
7.9%
Estimated Equity
$344,175
Purchase Details
Closed on
Jun 27, 1997
Sold by
O'Donnell Martin
Bought by
Reeves Marc J
Home Financials for this Owner
Home Financials are based on the most recent Mortgage that was taken out on this home.
Original Mortgage
$119,000
Interest Rate
7.86%
Purchase Details
Closed on
Feb 18, 1993
Sold by
Haggan Edward Gary and Gayle Lynn
Bought by
Odonnell Sharon and Martin,R Bedner
Create a Home Valuation Report for This Property
The Home Valuation Report is an in-depth analysis detailing your home's value as well as a comparison with similar homes in the area
Home Values in the Area
Average Home Value in this Area
Purchase History
| Date | Buyer | Sale Price | Title Company |
|---|---|---|---|
| Sorge Felix | $165,000 | -- | |
| Reeves Marc J | $149,000 | -- | |
| Odonnell Sharon | $151,000 | -- |
Source: Public Records
Mortgage History
| Date | Status | Borrower | Loan Amount |
|---|---|---|---|
| Open | Sorge Felix | $156,750 | |
| Previous Owner | Reeves Marc J | $119,000 |
Source: Public Records
Tax History
| Year | Tax Paid | Tax Assessment Tax Assessment Total Assessment is a certain percentage of the fair market value that is determined by local assessors to be the total taxable value of land and additions on the property. | Land | Improvement |
|---|---|---|---|---|
| 2025 | $9,583 | $329,300 | $192,500 | $136,800 |
| 2024 | $9,070 | $293,600 | $129,500 | $164,100 |
Source: Public Records
Map
Nearby Homes
- 13 Fairview Ave
- 77 Main St
- 10 Timbercroft Rd
- 44 Beavers St
- 0 Beavers St
- 521 Cokesbury Rd
- 5 Deer Run Dr
- 21 E Main St
- 69 Beavers St
- 56 E Main St
- 3 Chestnut Ct
- 2 Berrywood Ln
- 15 Patton St
- 9 Charles Ct
- 128 Annandale High Bridge Rd
- 16 Perry Rd
- 36 Crestview Dr
- 102-104 Cokesbury Rd
- 8 Appollo Place
- 22 Polktown Rd
Your Personal Tour Guide
Ask me questions while you tour the home.