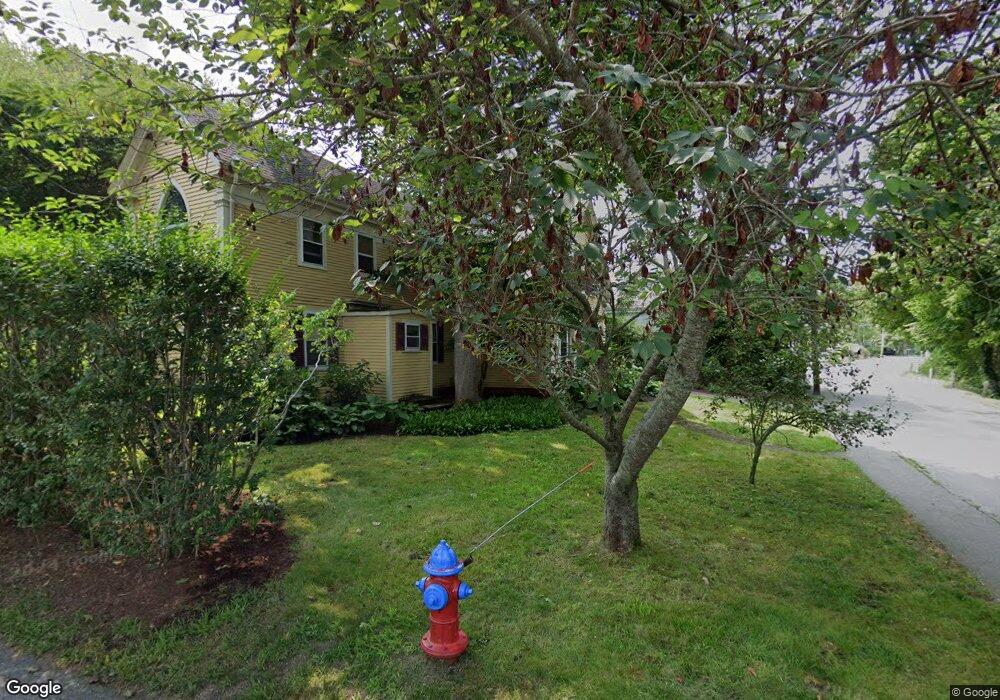
33 Cross St Wellfleet, MA 02667
Estimated Value: $1,353,000 - $1,474,571
4
Beds
2
Baths
1,900
Sq Ft
$751/Sq Ft
Est. Value
About This Home
This home is located at 33 Cross St, Wellfleet, MA 02667 and is currently estimated at $1,427,393, approximately $751 per square foot. 33 Cross St is a home located in Barnstable County with nearby schools including Wellfleet Elementary School, Nauset Regional Middle School, and Nauset Regional High School.
Ownership History
Date
Name
Owned For
Owner Type
Purchase Details
Closed on
May 31, 2005
Sold by
Lavallee Russell
Bought by
Kochen Allison and Mcpartland Edward J
Current Estimated Value
Home Financials for this Owner
Home Financials are based on the most recent Mortgage that was taken out on this home.
Original Mortgage
$240,000
Outstanding Balance
$125,134
Interest Rate
5.94%
Mortgage Type
Purchase Money Mortgage
Estimated Equity
$1,302,259
Create a Home Valuation Report for This Property
The Home Valuation Report is an in-depth analysis detailing your home's value as well as a comparison with similar homes in the area
Home Values in the Area
Average Home Value in this Area
Purchase History
| Date | Buyer | Sale Price | Title Company |
|---|---|---|---|
| Kochen Allison | $385,000 | -- | |
| Kochen Allison | $385,000 | -- |
Source: Public Records
Mortgage History
| Date | Status | Borrower | Loan Amount |
|---|---|---|---|
| Open | Kochen Allison | $240,000 | |
| Closed | Kochen Allison | $240,000 |
Source: Public Records
Tax History
| Year | Tax Paid | Tax Assessment Tax Assessment Total Assessment is a certain percentage of the fair market value that is determined by local assessors to be the total taxable value of land and additions on the property. | Land | Improvement |
|---|---|---|---|---|
| 2025 | $8,819 | $1,240,400 | $431,000 | $809,400 |
| 2024 | $8,171 | $1,196,400 | $410,500 | $785,900 |
| 2023 | $7,321 | $1,051,800 | $347,900 | $703,900 |
| 2022 | $6,296 | $809,300 | $305,200 | $504,100 |
| 2021 | $5,723 | $728,100 | $272,500 | $455,600 |
| 2020 | $5,509 | $710,800 | $277,200 | $433,600 |
| 2019 | $5,374 | $695,200 | $277,200 | $418,000 |
| 2018 | $4,935 | $687,300 | $277,200 | $410,100 |
| 2017 | $4,635 | $683,700 | $277,200 | $406,500 |
| 2016 | $4,046 | $592,400 | $236,700 | $355,700 |
| 2015 | $3,979 | $586,800 | $234,300 | $352,500 |
Source: Public Records
Map
Nearby Homes
- 20 Bank St
- 35 Holbrook Ave
- 164 Kendrick Ave Unit C
- 40 Old Long Pond Rd
- 30 Harbor View Cir
- 135 Marven Way
- 37 Oak Valley Rd
- 49 Oak Valley Rd
- 320 Coles Neck Rd
- 105 Howard Ct
- 345 Cove Rd
- 45 Indian Neck Rd
- 30 Sam Hollow Rd
- 2032 State Hwy Rte 6 Unit F/ (6)
- 7 Arrowhead Farm Rd
- 175 Delphi Path
- 1937 State Highway Route 6 Unit E
- 1937 State Highway Route 6 Unit E
- 344 King Phillip Rd
- 95 Old County Rd
Your Personal Tour Guide
Ask me questions while you tour the home.