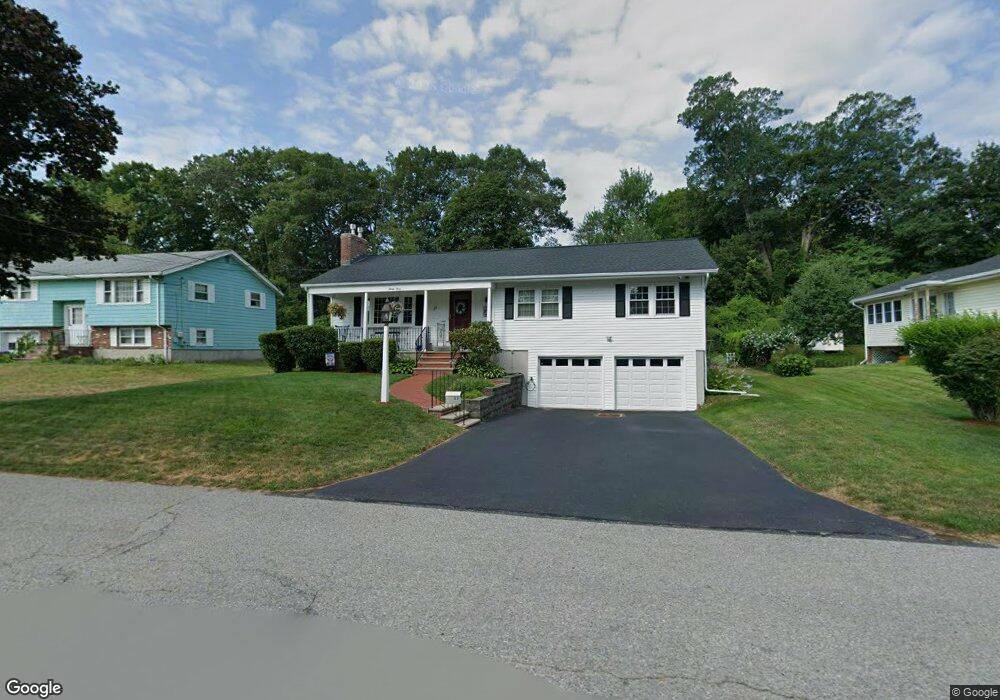
33 Dancause Rd Lowell, MA 01852
Belvidere NeighborhoodEstimated Value: $600,000 - $648,035
3
Beds
2
Baths
1,513
Sq Ft
$413/Sq Ft
Est. Value
About This Home
This home is located at 33 Dancause Rd, Lowell, MA 01852 and is currently estimated at $625,259, approximately $413 per square foot. 33 Dancause Rd is a home located in Middlesex County with nearby schools including Moody Elementary School, Abraham Lincoln Elementary School, and Greenhalge Elementary School.
Ownership History
Date
Name
Owned For
Owner Type
Purchase Details
Closed on
Aug 22, 2023
Sold by
Santamaria Carl J and Santamaria Virginia S
Bought by
Santamaria Ft and Santamaria
Current Estimated Value
Purchase Details
Closed on
Sep 23, 2020
Sold by
Santamaria Carl J and Santamaria Virginia S
Bought by
Santamaria Carl J and Santamaria Virginia S
Create a Home Valuation Report for This Property
The Home Valuation Report is an in-depth analysis detailing your home's value as well as a comparison with similar homes in the area
Home Values in the Area
Average Home Value in this Area
Purchase History
| Date | Buyer | Sale Price | Title Company |
|---|---|---|---|
| Santamaria Ft | -- | None Available | |
| Santamaria Ft | -- | None Available | |
| Santamaria Carl J | -- | None Available | |
| Santamaria Carl J | -- | None Available | |
| Santamaria Carl J | -- | None Available |
Source: Public Records
Tax History Compared to Growth
Tax History
| Year | Tax Paid | Tax Assessment Tax Assessment Total Assessment is a certain percentage of the fair market value that is determined by local assessors to be the total taxable value of land and additions on the property. | Land | Improvement |
|---|---|---|---|---|
| 2025 | $6,579 | $573,100 | $247,700 | $325,400 |
| 2024 | $6,225 | $522,700 | $231,600 | $291,100 |
| 2023 | $5,911 | $475,900 | $201,300 | $274,600 |
| 2022 | $5,141 | $405,100 | $183,000 | $222,100 |
| 2021 | $4,965 | $368,900 | $159,200 | $209,700 |
| 2020 | $4,613 | $345,300 | $159,200 | $186,100 |
| 2019 | $4,885 | $347,900 | $158,300 | $189,600 |
| 2018 | $4,672 | $324,700 | $150,800 | $173,900 |
| 2017 | $4,531 | $303,700 | $140,000 | $163,700 |
| 2016 | $4,237 | $279,500 | $128,800 | $150,700 |
| 2015 | $4,266 | $275,600 | $128,800 | $146,800 |
| 2013 | $4,006 | $266,900 | $142,100 | $124,800 |
Source: Public Records
Map
Nearby Homes
- 45 Clark Rd
- 251 Clark Rd
- 288 Hovey St
- 127 Thornton Ave
- 173 Merrimack Meadows Ln Unit 162
- 111 Draper St
- 16 Winding Ln
- 67 Hood Rd
- 67 Wedgemere Dr
- 100 Merrimack Ave Unit 25
- 164 Bradley St
- 42 Christian St Unit Lot 17
- 81 Reservoir St
- 89 Newbury St
- 71 Milton St
- 820 Methuen St Unit 820
- 120 Amesbury St
- Lot 11 Christian St
- Lot 12 Christian St
- Lot 9 Christian St