33 Dunster Rd Needham Heights, MA 02494
Estimated Value: $1,467,000 - $1,674,446
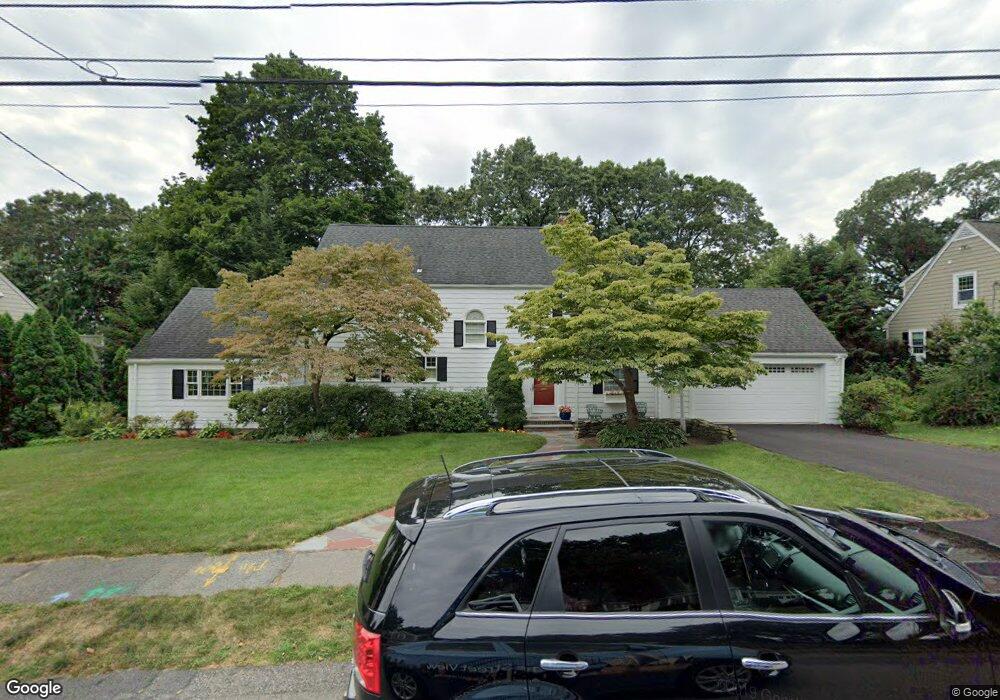
About This Home
This home is located at 33 Dunster Rd, Needham Heights, MA 02494 and is currently estimated at $1,580,362, approximately $1,248 per square foot. 33 Dunster Rd is a home located in Norfolk County with nearby schools including Mitchell Elementary School, High Rock Middle School, and Pollard Middle School.
Ownership History
We collect this data history from publicly available records. To have your information removed, we recommend requesting removal directly through your county’s website.
Purchase Details
Purchase Details
Home Values in the Area
Average Home Value in this Area
Purchase History
We collect this data history from publicly available records. To have your information removed, we recommend requesting removal directly through your county’s website.
| Date | Buyer | Sale Price | Title Company |
|---|---|---|---|
| -- | None Available | ||
| -- | None Available | ||
| $66,000 | -- |
Mortgage History
We collect this data history from publicly available records. To have your information removed, we recommend requesting removal directly through your county’s website.
| Date | Status | Borrower | Loan Amount |
|---|---|---|---|
| Previous Owner | $313,500 | ||
| Previous Owner | $50,000 |
Tax History
We collect this data history from publicly available records. To have your information removed, we recommend requesting removal directly through your county’s website.
| Year | Tax Paid | Tax Assessment Tax Assessment Total Assessment is a certain percentage of the fair market value that is determined by local assessors to be the total taxable value of land and additions on the property. | Land | Improvement |
|---|---|---|---|---|
| 2025 | $11,176 | $1,054,300 | $795,800 | $258,500 |
| 2024 | $11,431 | $913,000 | $568,200 | $344,800 |
| 2023 | $11,513 | $882,900 | $568,200 | $314,700 |
| 2022 | $10,767 | $805,300 | $500,400 | $304,900 |
| 2021 | $10,493 | $805,300 | $500,400 | $304,900 |
| 2020 | $9,981 | $799,100 | $500,400 | $298,700 |
| 2019 | $9,312 | $751,600 | $456,400 | $295,200 |
| 2018 | $8,929 | $751,600 | $456,400 | $295,200 |
| 2017 | $8,488 | $713,900 | $456,400 | $257,500 |
| 2016 | $8,238 | $713,900 | $456,400 | $257,500 |
| 2015 | $8,060 | $713,900 | $456,400 | $257,500 |
| 2014 | $7,760 | $666,700 | $416,400 | $250,300 |
Map
- 277 Brookline St
- 279 Brookline St Unit 279
- 490 Webster St
- 96 Richdale Rd
- 36 Upland Rd
- 246 Manning St
- 9 Morley St
- 15 Hawthorn Ave
- 1058 Highland Ave
- 18 Avon Cir
- 89 Melrose Ave
- 98 Falcon St
- 42 Woodbine Cir
- 42 Hawthorn Ave
- 70 Woodbine Cir
- 52 Beaufort Ave
- 23 Cheney St
- 447 Hillside Ave
- 100 Woodbine Cir
- 108 Woodbine Cir
Ask me questions while you tour the home.