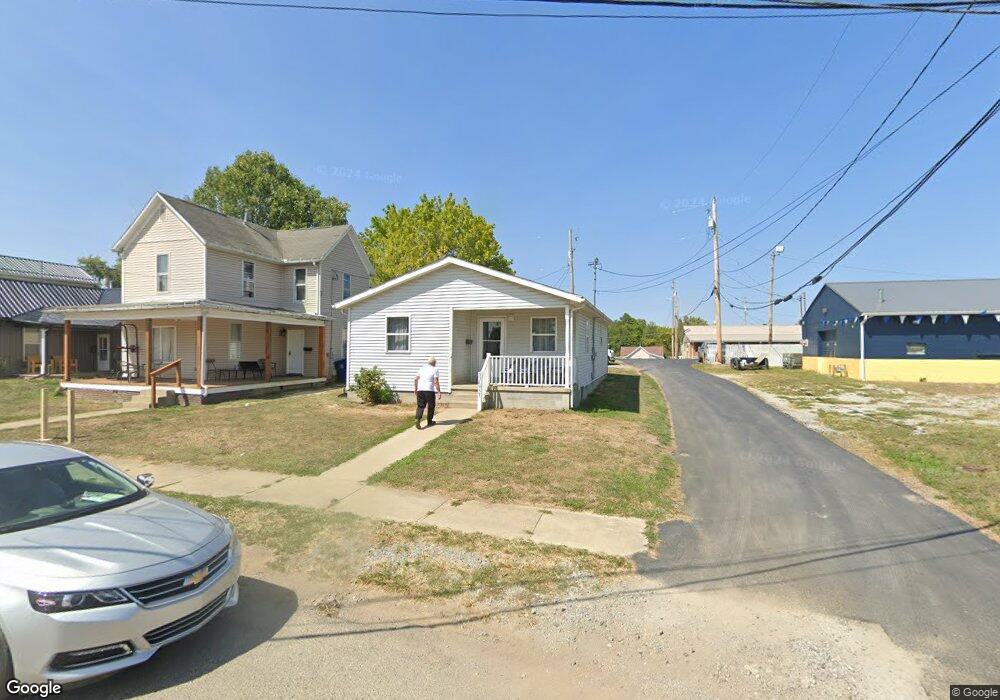
33 E 11th St Wellston, OH 45692
Estimated Value: $100,000 - $107,000
2
Beds
2
Baths
1,080
Sq Ft
$95/Sq Ft
Est. Value
About This Home
This home is located at 33 E 11th St, Wellston, OH 45692 and is currently estimated at $102,779, approximately $95 per square foot. 33 E 11th St is a home with nearby schools including Bundy Elementary School, Wellston Intermediate School, and Wellston Middle School.
Ownership History
Date
Name
Owned For
Owner Type
Purchase Details
Closed on
Jan 24, 2023
Sold by
Ronin Enterprises Llc
Bought by
Apple City Suds And Storage Llc
Current Estimated Value
Purchase Details
Closed on
Jan 25, 2018
Sold by
Wesbanco Bank Inc
Bought by
Ronin Enterprises Llc
Purchase Details
Closed on
Jan 18, 2014
Sold by
Oasis Rentals Llc
Bought by
Nelson Annette
Home Financials for this Owner
Home Financials are based on the most recent Mortgage that was taken out on this home.
Original Mortgage
$59,084
Interest Rate
4.19%
Mortgage Type
Seller Take Back
Purchase Details
Closed on
Oct 30, 2007
Sold by
Kinnison Michael A and Kinnison Nealy M
Bought by
Oasis Rentals Llc
Home Financials for this Owner
Home Financials are based on the most recent Mortgage that was taken out on this home.
Original Mortgage
$60,000
Interest Rate
6.45%
Mortgage Type
Future Advance Clause Open End Mortgage
Purchase Details
Closed on
Sep 29, 2003
Sold by
West Helen J
Bought by
Denney Kevin E and Denney Ruth
Create a Home Valuation Report for This Property
The Home Valuation Report is an in-depth analysis detailing your home's value as well as a comparison with similar homes in the area
Home Values in the Area
Average Home Value in this Area
Purchase History
| Date | Buyer | Sale Price | Title Company |
|---|---|---|---|
| Apple City Suds And Storage Llc | $120,000 | Northwest Title | |
| Ronin Enterprises Llc | $14,520 | Ohio Title Corp | |
| Nelson Annette | $59,084 | None Available | |
| Oasis Rentals Llc | -- | None Available | |
| Denney Kevin E | $46,900 | -- |
Source: Public Records
Mortgage History
| Date | Status | Borrower | Loan Amount |
|---|---|---|---|
| Previous Owner | Nelson Annette | $59,084 | |
| Previous Owner | Oasis Rentals Llc | $60,000 | |
| Previous Owner | Oasis Rentals Llc | $210,000 |
Source: Public Records
Tax History
| Year | Tax Paid | Tax Assessment Tax Assessment Total Assessment is a certain percentage of the fair market value that is determined by local assessors to be the total taxable value of land and additions on the property. | Land | Improvement |
|---|---|---|---|---|
| 2024 | $753 | $19,930 | $3,020 | $16,910 |
| 2023 | $752 | $19,930 | $3,020 | $16,910 |
| 2022 | $1,210 | $25,570 | $2,600 | $22,970 |
| 2021 | $1,184 | $25,570 | $2,600 | $22,970 |
| 2020 | $1,047 | $25,570 | $2,600 | $22,970 |
| 2019 | $1,427 | $24,830 | $2,520 | $22,310 |
| 2018 | $1,411 | $24,830 | $2,520 | $22,310 |
| 2017 | $973 | $24,830 | $2,520 | $22,310 |
| 2016 | $4,274 | $22,860 | $2,800 | $20,060 |
| 2015 | $903 | $22,860 | $2,800 | $20,060 |
| 2013 | $867 | $23,010 | $2,800 | $20,210 |
| 2012 | $897 | $23,010 | $2,800 | $20,210 |
Source: Public Records
Map
Nearby Homes
- 52 W 10th St
- 0 Ohio 327
- 1254 S New York Ave
- 303 E 9th St
- 416 S New York Ave
- 1304 S New Jersey Ave
- 432 S Michigan Ave
- 1409 S New Jersey Ave
- 1436 S New York Ave
- 1440 S New York Ave
- 224 E 2nd St
- 1409 S Massachusetts Ave
- 760 S Rhode Island Ave
- 424 S Missouri Ave
- 16 E Broadway St
- 1258 S Rhode Island Ave
- 2417 Glenroy Rd
- 1309 S Maine Ave
- 521 W Broadway St
- 319 N Park Ave
- 31 E 11th St
- 29 E 11th St
- 21 E 11th St
- 34 E 10th St
- 19 E 11th St
- 30 E 10th St
- 26 E 10th St
- 5 W 11th St
- 0 S Ohio Ave
- 1122 S Ohio Ave
- 1029 S Pennsylvania Ave
- 1029 S Pennsylvania Ave
- 33 E 10th St
- 37 E 10th St
- 29 E 10th St
- 1124 S Ohio Ave
- 41 E 10th St
- 923 S Pennsylvania Ave
- 1024 S Pennsylvania Ave Unit Rear
- 14 E 10th St
Your Personal Tour Guide
Ask me questions while you tour the home.