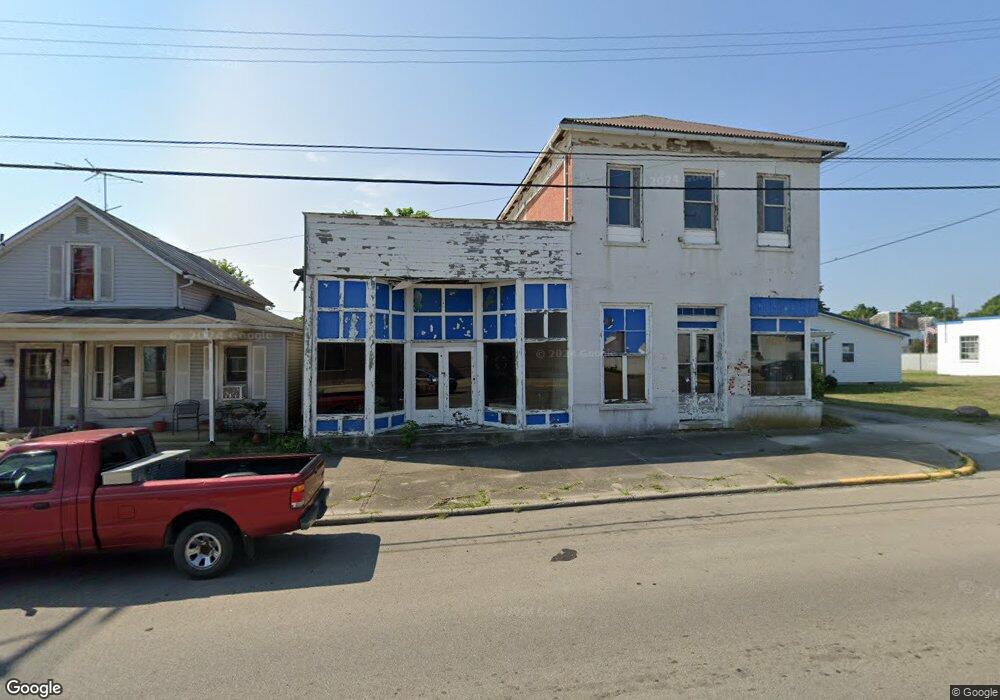
33 E Front St New Holland, OH 43145
Estimated Value: $42,218
Studio
--
Bath
5,855
Sq Ft
$7/Sq Ft
Est. Value
About This Home
This home is located at 33 E Front St, New Holland, OH 43145 and is currently estimated at $42,218, approximately $7 per square foot. 33 E Front St is a home located in Pickaway County with nearby schools including Miami Trace Elementary School, Miami Trace Middle School, and Miami Trace High School.
Ownership History
Date
Name
Owned For
Owner Type
Purchase Details
Closed on
Jan 3, 2020
Sold by
Whiteside Cristi A
Bought by
Yaney Joseph D
Current Estimated Value
Purchase Details
Closed on
Mar 11, 2011
Sold by
Lucas Philip D
Bought by
Yaney Joseph D and Whiteside Cristi A
Home Financials for this Owner
Home Financials are based on the most recent Mortgage that was taken out on this home.
Original Mortgage
$14,000
Interest Rate
4.88%
Mortgage Type
Future Advance Clause Open End Mortgage
Purchase Details
Closed on
Jun 27, 2008
Sold by
9 West Front Street Ltd
Bought by
Lucas Philip D
Purchase Details
Closed on
Dec 30, 2006
Sold by
Kirkpatrick Bruce D and Kirkpatrick Randy C
Bought by
15 East Front Street Ltd
Purchase Details
Closed on
Dec 13, 2006
Sold by
Estate Of Ansel W Kirkpatrick Jr
Bought by
Kirkpatrick Randy C and Kirkpatrick Danny E
Create a Home Valuation Report for This Property
The Home Valuation Report is an in-depth analysis detailing your home's value as well as a comparison with similar homes in the area
Purchase History
| Date | Buyer | Sale Price | Title Company |
|---|---|---|---|
| Yaney Joseph D | -- | None Available | |
| Yaney Joseph D | $18,000 | Washington Title Agency | |
| Lucas Philip D | $7,000 | None Available | |
| 15 East Front Street Ltd | -- | Cornerstone Title Agency Llc | |
| 9 West Front Street Ltd | -- | None Available | |
| Kirkpatrick Randy C | -- | None Available |
Source: Public Records
Mortgage History
| Date | Status | Borrower | Loan Amount |
|---|---|---|---|
| Previous Owner | Yaney Joseph D | $14,000 |
Source: Public Records
Tax History
| Year | Tax Paid | Tax Assessment Tax Assessment Total Assessment is a certain percentage of the fair market value that is determined by local assessors to be the total taxable value of land and additions on the property. | Land | Improvement |
|---|---|---|---|---|
| 2025 | $327 | $5,920 | $2,590 | $3,330 |
| 2024 | $327 | $5,920 | $2,590 | $3,330 |
| 2023 | $322 | $5,920 | $2,590 | $3,330 |
| 2022 | $348 | $6,510 | $2,590 | $3,920 |
| 2021 | $387 | $6,510 | $2,590 | $3,920 |
| 2020 | $380 | $6,510 | $2,590 | $3,920 |
| 2019 | $385 | $6,300 | $2,590 | $3,710 |
| 2018 | $380 | $6,300 | $2,590 | $3,710 |
| 2017 | $383 | $6,300 | $2,590 | $3,710 |
| 2016 | $386 | $6,150 | $2,550 | $3,600 |
| 2015 | $388 | $6,150 | $2,550 | $3,600 |
| 2014 | $369 | $6,150 | $2,550 | $3,600 |
| 2013 | $336 | $5,580 | $2,550 | $3,030 |
Source: Public Records
Map
Nearby Homes
- 112 E School St
- 209 S East St
- 25960 Egypt Pike
- 13525 Clarksburg Pike
- 24136 Egypt Pike
- 2922 SE Good Hope New Holland Rd SE
- 9948 Glaze Rd
- 7764 Glaze Rd
- 48 Deer Haven Ct NE
- 5181 Robinson Rd SE
- 75 Country Manor Dr SE
- 75 Country Manor Dr SE Unit SE
- 17310 High St
- 0 State Route 138
- 0 Lowes Blvd
- 716 Deer Creek Rd
- 301 S Water St
- 103 N Water St
- 212 Green St
- 0 Washington Waterloo Rd NE
Your Personal Tour Guide
Ask me questions while you tour the home.