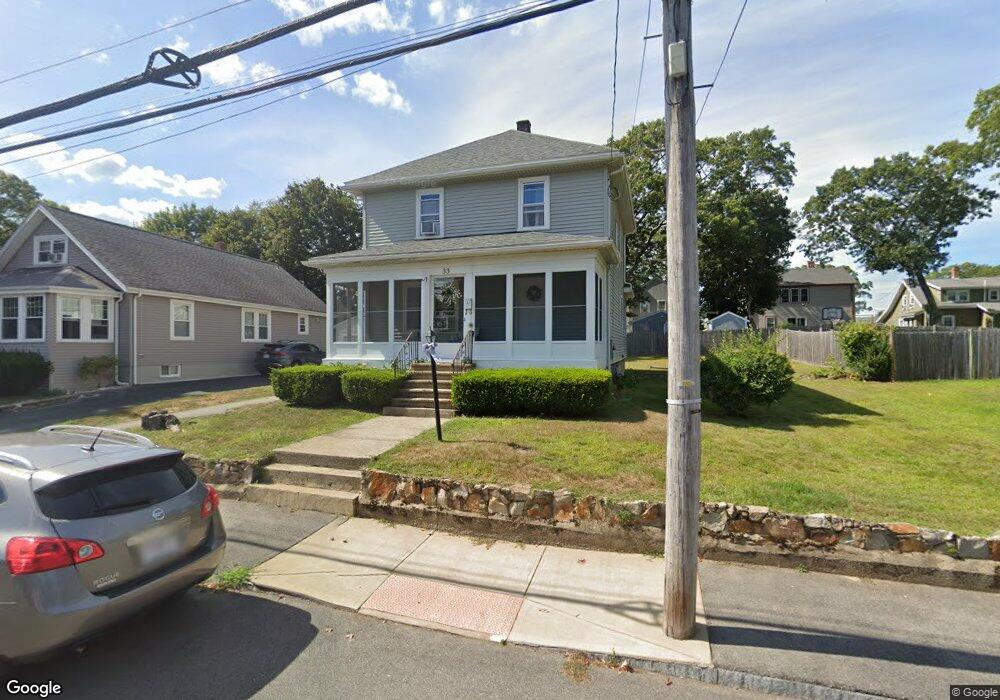
33 Edgemont Rd Braintree, MA 02184
East Braintree NeighborhoodEstimated Value: $623,000 - $705,000
3
Beds
1
Bath
1,494
Sq Ft
$444/Sq Ft
Est. Value
About This Home
This home is located at 33 Edgemont Rd, Braintree, MA 02184 and is currently estimated at $662,665, approximately $443 per square foot. 33 Edgemont Rd is a home located in Norfolk County with nearby schools including Braintree High School, Sacred Heart Elementary School, and South Shore Christian Academy.
Ownership History
Date
Name
Owned For
Owner Type
Purchase Details
Closed on
May 8, 2015
Sold by
Lyons Walter T
Bought by
Lyons Anne K
Current Estimated Value
Purchase Details
Closed on
Aug 24, 1988
Sold by
Jenkinson Diane D
Bought by
Lyons Walter T
Home Financials for this Owner
Home Financials are based on the most recent Mortgage that was taken out on this home.
Original Mortgage
$144,000
Interest Rate
10.36%
Mortgage Type
Purchase Money Mortgage
Create a Home Valuation Report for This Property
The Home Valuation Report is an in-depth analysis detailing your home's value as well as a comparison with similar homes in the area
Home Values in the Area
Average Home Value in this Area
Purchase History
| Date | Buyer | Sale Price | Title Company |
|---|---|---|---|
| Lyons Anne K | -- | -- | |
| Lyons Walter T | $152,650 | -- |
Source: Public Records
Mortgage History
| Date | Status | Borrower | Loan Amount |
|---|---|---|---|
| Previous Owner | Lyons Walter T | $232,000 | |
| Previous Owner | Lyons Walter T | $144,000 |
Source: Public Records
Tax History Compared to Growth
Tax History
| Year | Tax Paid | Tax Assessment Tax Assessment Total Assessment is a certain percentage of the fair market value that is determined by local assessors to be the total taxable value of land and additions on the property. | Land | Improvement |
|---|---|---|---|---|
| 2025 | $5,915 | $592,700 | $347,700 | $245,000 |
| 2024 | $5,278 | $556,800 | $315,700 | $241,100 |
| 2023 | $4,993 | $511,600 | $283,700 | $227,900 |
| 2022 | $4,817 | $484,100 | $256,200 | $227,900 |
| 2021 | $4,310 | $433,200 | $231,500 | $201,700 |
| 2020 | $3,979 | $403,600 | $210,500 | $193,100 |
| 2019 | $3,856 | $382,200 | $201,300 | $180,900 |
| 2018 | $3,758 | $356,500 | $183,000 | $173,500 |
| 2017 | $3,625 | $337,500 | $173,900 | $163,600 |
| 2016 | $3,530 | $321,500 | $164,700 | $156,800 |
| 2015 | $3,194 | $288,500 | $137,200 | $151,300 |
| 2014 | $3,105 | $271,900 | $131,800 | $140,100 |
Source: Public Records
Map
Nearby Homes
- 67 Somerville Ave
- 116 Gordon Rd
- 312 Shaw St
- 125 Allen St Unit A
- 129 Audubon Ave
- 141 Hobart St
- 159 Hobart St
- 141 Commercial St Unit 9
- 9 Hillside Ave
- 41 Lantern Ln
- 37 Lantern Ln
- 74 Magnolia St
- 51 Faxon St
- 10 Skyline Dr Unit 5
- 122 Washington St Unit 22
- 30 Skyline Dr Unit 6
- 11 Richmond St
- 15 1st St
- 38 Idlewell St
- 25 W Howard St Unit D2