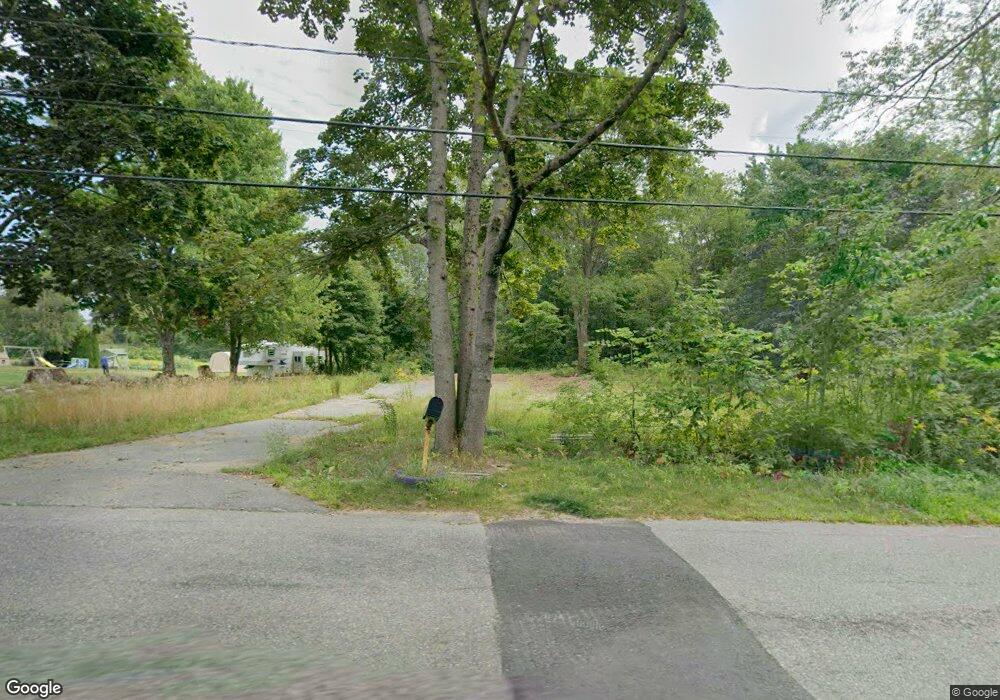
33 Elmwood Rd Winchendon, MA 01475
Estimated Value: $333,000 - $388,000
3
Beds
1
Bath
1,676
Sq Ft
$210/Sq Ft
Est. Value
About This Home
This home is located at 33 Elmwood Rd, Winchendon, MA 01475 and is currently estimated at $351,911, approximately $209 per square foot. 33 Elmwood Rd is a home located in Worcester County with nearby schools including Memorial, Toy Town Elementary School, and The Winchendon School.
Ownership History
Date
Name
Owned For
Owner Type
Purchase Details
Closed on
Feb 12, 2024
Sold by
Davenport Kenneth
Bought by
Rj Davenport & Sons Llc
Current Estimated Value
Purchase Details
Closed on
Jan 18, 2024
Sold by
Dsv Spv1 Llc
Bought by
Davenport Kenneth
Purchase Details
Closed on
Aug 1, 2017
Sold by
Kaja Holdings Llc
Bought by
Dsv Spv 1 Llc
Purchase Details
Closed on
Apr 12, 2013
Sold by
Fnma
Bought by
Kaja Holdings Llc
Purchase Details
Closed on
Apr 24, 2012
Sold by
Martin Randall J and Bank Of America Na
Bought by
Federal National Mortgage Association
Purchase Details
Closed on
Oct 15, 2007
Sold by
Martin Randall J
Bought by
Martin Randall J and Martin Susan E
Home Financials for this Owner
Home Financials are based on the most recent Mortgage that was taken out on this home.
Original Mortgage
$129,600
Interest Rate
6.49%
Mortgage Type
Purchase Money Mortgage
Purchase Details
Closed on
Jan 22, 1987
Sold by
Leavens C N
Bought by
Howe John C
Create a Home Valuation Report for This Property
The Home Valuation Report is an in-depth analysis detailing your home's value as well as a comparison with similar homes in the area
Home Values in the Area
Average Home Value in this Area
Purchase History
| Date | Buyer | Sale Price | Title Company |
|---|---|---|---|
| Rj Davenport & Sons Llc | -- | None Available | |
| Rj Davenport & Sons Llc | -- | None Available | |
| Davenport Kenneth | $40,900 | None Available | |
| Davenport Kenneth | $40,900 | None Available | |
| Dsv Spv 1 Llc | -- | -- | |
| Dsv Spv 1 Llc | -- | -- | |
| Kaja Holdings Llc | -- | -- | |
| Kaja Holdings Llc | -- | -- | |
| Federal National Mortgage Association | $180,530 | -- | |
| Federal National Mortgage Association | $180,530 | -- | |
| Martin Randall J | -- | -- | |
| Martin Randall J | -- | -- | |
| Martin Randall J | -- | -- | |
| Martin Randall J | $162,000 | -- | |
| Howe John C | $76,000 | -- |
Source: Public Records
Mortgage History
| Date | Status | Borrower | Loan Amount |
|---|---|---|---|
| Previous Owner | Martin Randall J | $129,600 | |
| Previous Owner | Martin Randall J | $32,400 |
Source: Public Records
Tax History Compared to Growth
Tax History
| Year | Tax Paid | Tax Assessment Tax Assessment Total Assessment is a certain percentage of the fair market value that is determined by local assessors to be the total taxable value of land and additions on the property. | Land | Improvement |
|---|---|---|---|---|
| 2025 | $3,237 | $275,500 | $46,500 | $229,000 |
| 2024 | $3,144 | $250,700 | $45,300 | $205,400 |
| 2023 | $3,290 | $245,500 | $43,300 | $202,200 |
| 2022 | $2,325 | $153,900 | $50,000 | $103,900 |
| 2021 | $2,158 | $137,300 | $48,000 | $89,300 |
| 2020 | $2,110 | $129,600 | $45,700 | $83,900 |
| 2019 | $2,010 | $120,300 | $43,300 | $77,000 |
| 2018 | $1,935 | $111,500 | $42,500 | $69,000 |
| 2017 | $1,671 | $93,000 | $34,800 | $58,200 |
| 2016 | $1,567 | $89,900 | $33,200 | $56,700 |
| 2015 | $2,062 | $123,300 | $33,200 | $90,100 |
| 2014 | $2,014 | $126,200 | $39,800 | $86,400 |
Source: Public Records
Map
Nearby Homes