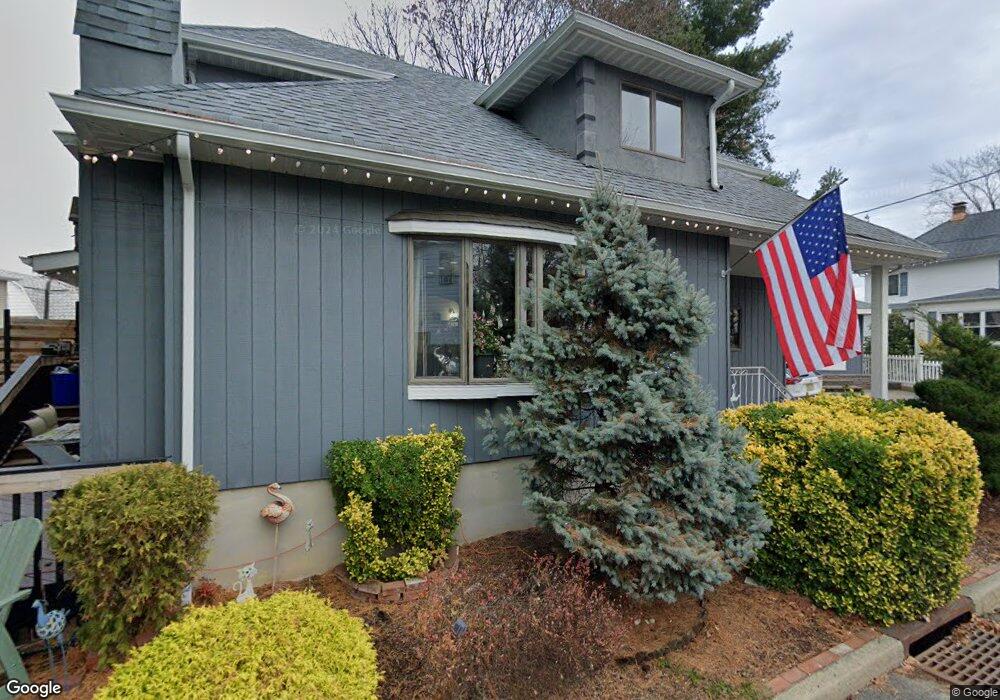
33 Exton St South River, NJ 08882
Estimated Value: $460,468 - $521,000
4
Beds
2
Baths
1,544
Sq Ft
$315/Sq Ft
Est. Value
About This Home
This home is located at 33 Exton St, South River, NJ 08882 and is currently estimated at $487,117, approximately $315 per square foot. 33 Exton St is a home located in Middlesex County with nearby schools including South River Primary School, South River Elementary School, and South River Middle School.
Ownership History
Date
Name
Owned For
Owner Type
Purchase Details
Closed on
Jul 29, 2005
Sold by
Kislin Donald
Bought by
Diaz Gilka
Current Estimated Value
Home Financials for this Owner
Home Financials are based on the most recent Mortgage that was taken out on this home.
Original Mortgage
$240,000
Interest Rate
5.93%
Purchase Details
Closed on
Jun 5, 2001
Sold by
Powell Raymond
Bought by
Feith Robert and Feith Alison
Home Financials for this Owner
Home Financials are based on the most recent Mortgage that was taken out on this home.
Original Mortgage
$159,080
Interest Rate
7.09%
Create a Home Valuation Report for This Property
The Home Valuation Report is an in-depth analysis detailing your home's value as well as a comparison with similar homes in the area
Home Values in the Area
Average Home Value in this Area
Purchase History
| Date | Buyer | Sale Price | Title Company |
|---|---|---|---|
| Diaz Gilka | $300,000 | -- | |
| Feith Robert | $164,000 | -- |
Source: Public Records
Mortgage History
| Date | Status | Borrower | Loan Amount |
|---|---|---|---|
| Previous Owner | Diaz Gilka | $240,000 | |
| Previous Owner | Feith Robert | $159,080 |
Source: Public Records
Tax History Compared to Growth
Tax History
| Year | Tax Paid | Tax Assessment Tax Assessment Total Assessment is a certain percentage of the fair market value that is determined by local assessors to be the total taxable value of land and additions on the property. | Land | Improvement |
|---|---|---|---|---|
| 2025 | $5,998 | $235,500 | $96,800 | $138,700 |
| 2024 | $5,819 | $235,500 | $96,800 | $138,700 |
| 2023 | $5,819 | $235,500 | $96,800 | $138,700 |
| 2022 | $5,718 | $235,500 | $96,800 | $138,700 |
| 2021 | $3,755 | $235,500 | $96,800 | $138,700 |
| 2020 | $5,386 | $235,500 | $96,800 | $138,700 |
| 2019 | $5,115 | $62,100 | $23,600 | $38,500 |
| 2018 | $4,992 | $62,100 | $23,600 | $38,500 |
| 2017 | $4,810 | $62,100 | $23,600 | $38,500 |
| 2016 | $4,628 | $62,100 | $23,600 | $38,500 |
| 2015 | $4,524 | $62,100 | $23,600 | $38,500 |
| 2014 | $4,420 | $62,100 | $23,600 | $38,500 |
Source: Public Records
Map
Nearby Homes
- 212 Old Bridge Turnpike
- 28 Johnson Place
- 5 David St
- 5 Fairview Ave
- 86 Hillside Ave
- 188 Prigmore St
- 22 Roosevelt St
- 19 Wilcox Ave
- 147 Old Bridge Turnpike
- 33 W Grochowiak St
- 363 Cranbury Rd Unit B7
- 48 Harvey Cir
- 11 Davison Ave
- 16 Pulawski Ave
- 23 W Grochowiak St
- 13 Garwood St
- 150 Main St
- 125 Johnson Place
- 216 Willett Ave
- 67 Kamm Ave