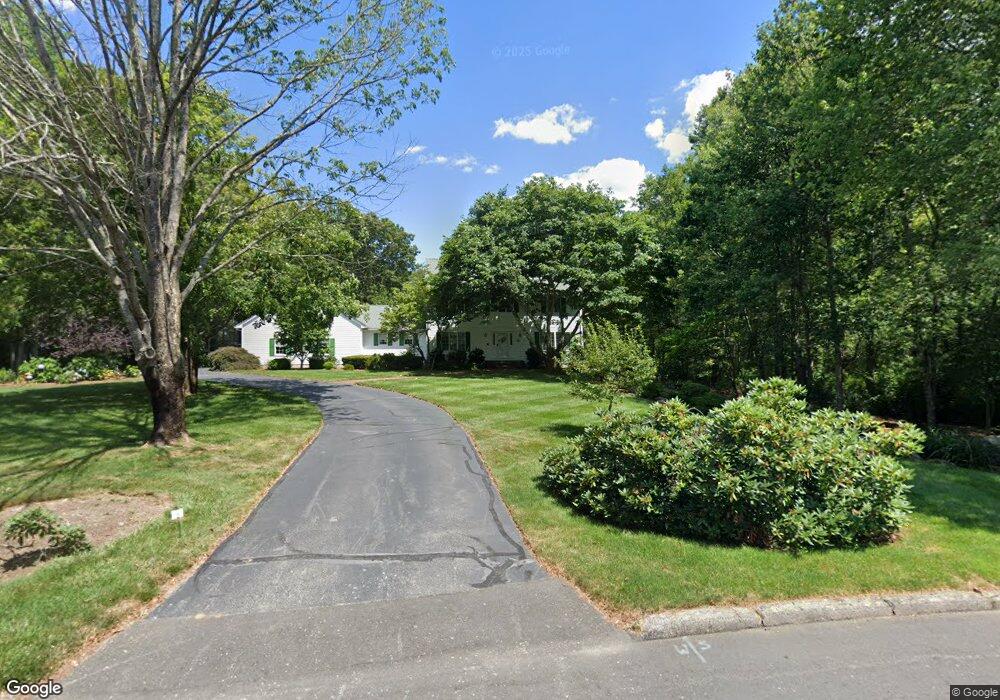
33 Fairway Dr Seekonk, MA 02771
Estimated Value: $909,269 - $1,083,000
3
Beds
2
Baths
3,194
Sq Ft
$310/Sq Ft
Est. Value
About This Home
This home is located at 33 Fairway Dr, Seekonk, MA 02771 and is currently estimated at $990,817, approximately $310 per square foot. 33 Fairway Dr is a home located in Bristol County with nearby schools including Seekonk High School, St Cecilia School, and Saint Teresa Catholic Elementary School.
Ownership History
Date
Name
Owned For
Owner Type
Purchase Details
Closed on
Dec 23, 2019
Sold by
Romanovich Gail R
Bought by
Gail R Romanovich Lt and Romanovich
Current Estimated Value
Purchase Details
Closed on
Oct 10, 1991
Sold by
Marshall Robert J and Marshall Deborah W
Bought by
Romanovich Carl A and Romanovich Gail R
Home Financials for this Owner
Home Financials are based on the most recent Mortgage that was taken out on this home.
Original Mortgage
$175,000
Interest Rate
8.8%
Create a Home Valuation Report for This Property
The Home Valuation Report is an in-depth analysis detailing your home's value as well as a comparison with similar homes in the area
Home Values in the Area
Average Home Value in this Area
Purchase History
| Date | Buyer | Sale Price | Title Company |
|---|---|---|---|
| Gail R Romanovich Lt | -- | None Available | |
| Romanovich Carl A | $285,000 | -- |
Source: Public Records
Mortgage History
| Date | Status | Borrower | Loan Amount |
|---|---|---|---|
| Previous Owner | Romanovich Carl A | $175,000 | |
| Previous Owner | Romanovich Carl A | $185,000 |
Source: Public Records
Tax History
| Year | Tax Paid | Tax Assessment Tax Assessment Total Assessment is a certain percentage of the fair market value that is determined by local assessors to be the total taxable value of land and additions on the property. | Land | Improvement |
|---|---|---|---|---|
| 2025 | $10,369 | $839,600 | $213,000 | $626,600 |
| 2024 | $9,870 | $799,200 | $213,000 | $586,200 |
| 2023 | $9,568 | $729,800 | $195,200 | $534,600 |
| 2022 | $8,683 | $650,900 | $195,200 | $455,700 |
| 2021 | $8,393 | $618,500 | $172,100 | $446,400 |
| 2020 | $8,343 | $633,500 | $172,300 | $461,200 |
| 2019 | $7,973 | $610,500 | $172,300 | $438,200 |
| 2018 | $7,840 | $587,300 | $172,300 | $415,000 |
| 2017 | $7,571 | $562,500 | $174,200 | $388,300 |
| 2016 | $7,480 | $557,800 | $174,200 | $383,600 |
| 2015 | $7,278 | $550,100 | $174,200 | $375,900 |
Source: Public Records
Map
Nearby Homes
Your Personal Tour Guide
Ask me questions while you tour the home.