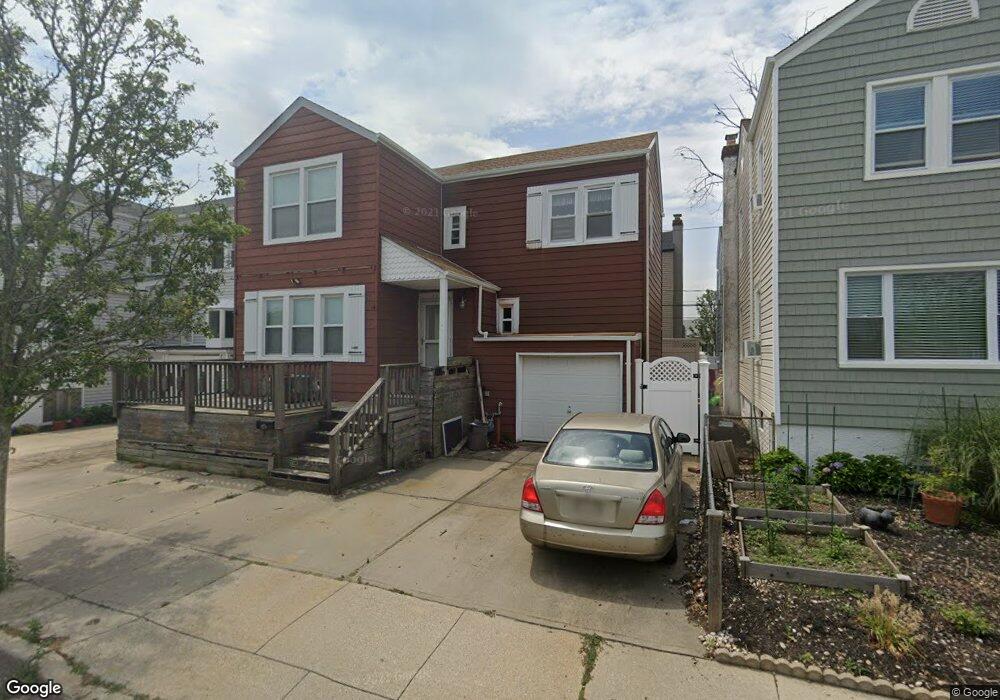
33 Farrell St Long Beach, NY 11561
Estimated Value: $732,832 - $818,000
--
Bed
1
Bath
1,200
Sq Ft
$646/Sq Ft
Est. Value
About This Home
This home is located at 33 Farrell St, Long Beach, NY 11561 and is currently estimated at $775,416, approximately $646 per square foot. 33 Farrell St is a home located in Nassau County with nearby schools including Lido Elementary School, East Elementary School, and Lindell Elementary School.
Ownership History
Date
Name
Owned For
Owner Type
Purchase Details
Closed on
Feb 3, 2025
Sold by
Denardo Richard
Bought by
Denardo Richard and Richard Denardo Family Revocable Trust
Current Estimated Value
Purchase Details
Closed on
Oct 15, 2009
Sold by
Haran Edward and Haran Patricia
Bought by
Denardo Richard
Home Financials for this Owner
Home Financials are based on the most recent Mortgage that was taken out on this home.
Original Mortgage
$280,000
Outstanding Balance
$181,900
Interest Rate
4.98%
Mortgage Type
Purchase Money Mortgage
Estimated Equity
$593,516
Purchase Details
Closed on
Jun 4, 2004
Sold by
Haran Eileen
Create a Home Valuation Report for This Property
The Home Valuation Report is an in-depth analysis detailing your home's value as well as a comparison with similar homes in the area
Home Values in the Area
Average Home Value in this Area
Purchase History
| Date | Buyer | Sale Price | Title Company |
|---|---|---|---|
| Denardo Richard | -- | None Available | |
| Denardo Richard | -- | None Available | |
| Denardo Richard | $380,000 | -- | |
| Denardo Richard | $380,000 | -- | |
| -- | -- | -- | |
| -- | -- | -- |
Source: Public Records
Mortgage History
| Date | Status | Borrower | Loan Amount |
|---|---|---|---|
| Open | Denardo Richard | $280,000 | |
| Closed | Denardo Richard | $280,000 |
Source: Public Records
Tax History Compared to Growth
Tax History
| Year | Tax Paid | Tax Assessment Tax Assessment Total Assessment is a certain percentage of the fair market value that is determined by local assessors to be the total taxable value of land and additions on the property. | Land | Improvement |
|---|---|---|---|---|
| 2025 | $6,831 | $517 | $189 | $328 |
| 2024 | $946 | $517 | $189 | $328 |
| 2023 | $6,519 | $517 | $189 | $328 |
| 2022 | $6,519 | $517 | $189 | $328 |
| 2021 | $12,923 | $495 | $181 | $314 |
| 2020 | $9,713 | $776 | $659 | $117 |
| 2019 | $6,437 | $776 | $552 | $224 |
| 2018 | $6,026 | $926 | $0 | $0 |
| 2017 | $5,325 | $926 | $659 | $267 |
| 2016 | $1,143 | $926 | $659 | $267 |
| 2015 | $1,137 | $926 | $659 | $267 |
| 2014 | $1,137 | $926 | $659 | $267 |
| 2013 | $1,086 | $926 | $659 | $267 |
Source: Public Records
Map
Nearby Homes
- 23 Vinton St
- 7 Vinton St
- 755 E Chester St
- 49 Barnes St
- 29 Curley St
- 18 Curley St
- 63 Kirkwood St
- 62 Clark St
- 189 Blackheath Rd
- 27 Kerrigan St
- 843 E Park Ave
- 732 E Park Ave
- 164 Blackheath Rd
- 140 Mitchell Ave
- 134 Coolidge Ave
- 133 Mitchell Ave
- 128 Belmont Ave
- 134 Cleveland Ave
- 661 E Olive St
- 625 E Walnut St