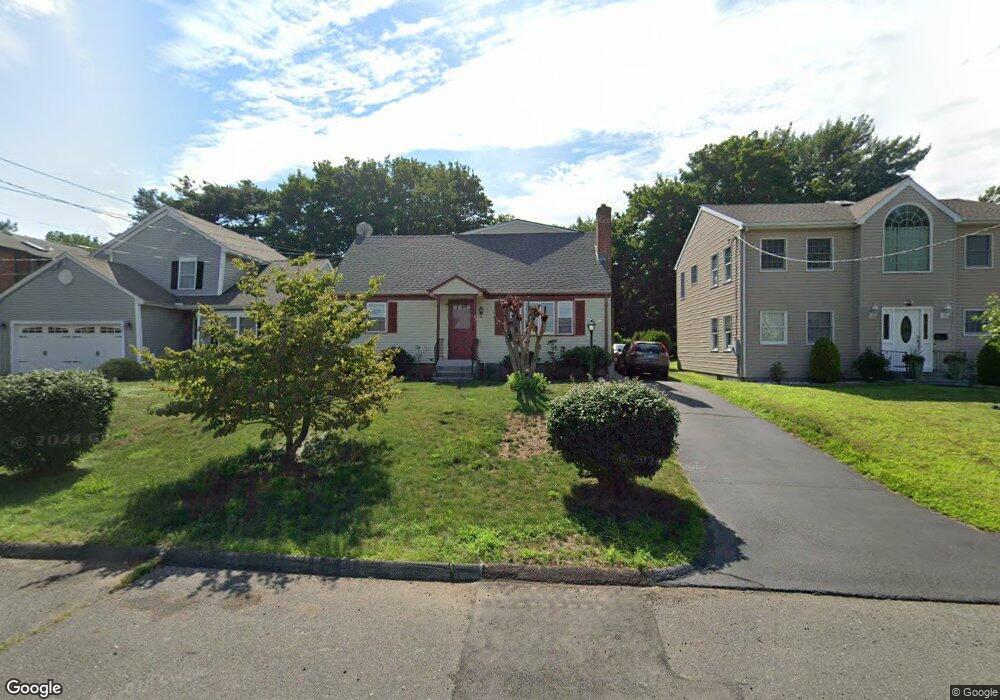
33 Fenwood Ave West Hartford, CT 06110
Estimated Value: $406,000 - $465,000
4
Beds
2
Baths
2,244
Sq Ft
$195/Sq Ft
Est. Value
About This Home
This home is located at 33 Fenwood Ave, West Hartford, CT 06110 and is currently estimated at $438,132, approximately $195 per square foot. 33 Fenwood Ave is a home located in Hartford County with nearby schools including Charter Oak International Academy, Sedgwick Middle School, and Conard High School.
Ownership History
Date
Name
Owned For
Owner Type
Purchase Details
Closed on
Jan 27, 1995
Sold by
Burney Robert and Burney Joyce Ann
Bought by
Nguyen Tram and Vantran Lue
Current Estimated Value
Home Financials for this Owner
Home Financials are based on the most recent Mortgage that was taken out on this home.
Original Mortgage
$85,950
Interest Rate
9.24%
Mortgage Type
Unknown
Create a Home Valuation Report for This Property
The Home Valuation Report is an in-depth analysis detailing your home's value as well as a comparison with similar homes in the area
Home Values in the Area
Average Home Value in this Area
Purchase History
| Date | Buyer | Sale Price | Title Company |
|---|---|---|---|
| Nguyen Tram | $122,800 | -- |
Source: Public Records
Mortgage History
| Date | Status | Borrower | Loan Amount |
|---|---|---|---|
| Closed | Nguyen Tram | $40,000 | |
| Closed | Nguyen Tram | $85,950 |
Source: Public Records
Tax History Compared to Growth
Tax History
| Year | Tax Paid | Tax Assessment Tax Assessment Total Assessment is a certain percentage of the fair market value that is determined by local assessors to be the total taxable value of land and additions on the property. | Land | Improvement |
|---|---|---|---|---|
| 2025 | $9,053 | $202,160 | $46,550 | $155,610 |
| 2024 | $8,561 | $202,160 | $46,550 | $155,610 |
| 2023 | $8,272 | $202,160 | $46,550 | $155,610 |
| 2022 | $8,224 | $202,160 | $46,550 | $155,610 |
| 2021 | $7,720 | $182,000 | $50,820 | $131,180 |
| 2020 | $7,254 | $173,530 | $39,130 | $134,400 |
| 2019 | $7,254 | $173,530 | $39,130 | $134,400 |
| 2018 | $7,115 | $173,530 | $39,130 | $134,400 |
| 2017 | $7,547 | $183,890 | $39,130 | $144,760 |
| 2016 | $6,618 | $167,510 | $48,790 | $118,720 |
| 2015 | $6,417 | $167,510 | $48,790 | $118,720 |
| 2014 | $6,260 | $167,510 | $48,790 | $118,720 |
Source: Public Records
Map
Nearby Homes
- 204 Trout Brook Dr
- 17 Parkview Rd
- 741 Quaker Ln S
- 90 Park Place Cir Unit 90
- 49 Park Place Cir Unit 49
- 1145 New Britain Ave
- 41 Page Ave
- 39 Cortland St
- 49 Somerset St
- 394 Trout Brook Dr
- 121 Cambridge St
- 61 Colonial St
- 101 Englewood Ave
- 937 New Britain Ave
- 18 Federal St
- 148 Colonial St
- 422 S Main St
- 107 Westgate St
- 93 Stanwood St
- 90 Meriline Ave