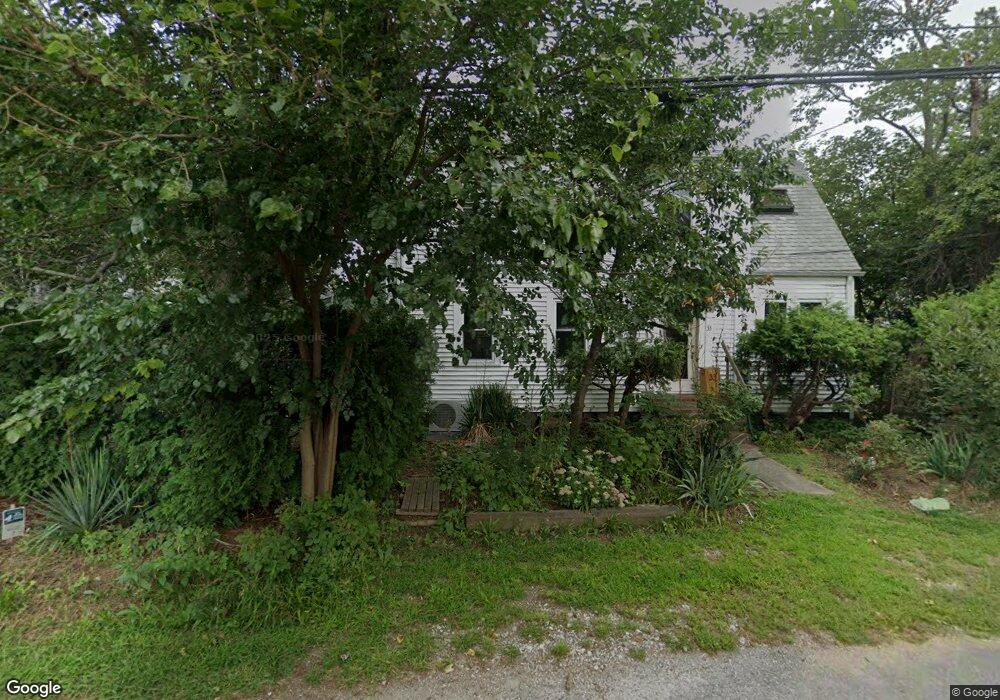
33 Fisher St Natick, MA 01760
Estimated Value: $703,000 - $909,000
3
Beds
1
Bath
1,347
Sq Ft
$582/Sq Ft
Est. Value
About This Home
This home is located at 33 Fisher St, Natick, MA 01760 and is currently estimated at $783,388, approximately $581 per square foot. 33 Fisher St is a home located in Middlesex County with nearby schools including Natick High School, Wilson Middle School, and Bennett-Hemenway (Ben-Hem) Elementary School.
Ownership History
Date
Name
Owned For
Owner Type
Purchase Details
Closed on
Sep 9, 2025
Sold by
Melancon Evelyn and Melancon Benjamin
Bought by
Melancon Lt and Melancon
Current Estimated Value
Purchase Details
Closed on
Aug 1, 1979
Bought by
Melancon John C and Melancon Evelyn
Create a Home Valuation Report for This Property
The Home Valuation Report is an in-depth analysis detailing your home's value as well as a comparison with similar homes in the area
Home Values in the Area
Average Home Value in this Area
Purchase History
| Date | Buyer | Sale Price | Title Company |
|---|---|---|---|
| Melancon Lt | -- | -- | |
| Melancon Lt | -- | -- | |
| Melancon Benjamin | -- | -- | |
| Melancon Benjamin | -- | -- | |
| Melancon John C | -- | -- |
Source: Public Records
Mortgage History
| Date | Status | Borrower | Loan Amount |
|---|---|---|---|
| Previous Owner | Melancon John C | $20,000 |
Source: Public Records
Tax History Compared to Growth
Tax History
| Year | Tax Paid | Tax Assessment Tax Assessment Total Assessment is a certain percentage of the fair market value that is determined by local assessors to be the total taxable value of land and additions on the property. | Land | Improvement |
|---|---|---|---|---|
| 2025 | $6,865 | $574,000 | $389,200 | $184,800 |
| 2024 | $6,623 | $540,200 | $366,300 | $173,900 |
| 2023 | $6,780 | $536,400 | $352,600 | $183,800 |
| 2022 | $6,515 | $488,400 | $320,500 | $167,900 |
| 2021 | $5,852 | $430,000 | $302,200 | $127,800 |
| 2020 | $5,870 | $431,300 | $288,400 | $142,900 |
| 2019 | $5,482 | $431,300 | $288,400 | $142,900 |
| 2018 | $5,257 | $402,800 | $274,700 | $128,100 |
| 2017 | $4,956 | $367,400 | $233,500 | $133,900 |
| 2016 | $4,602 | $339,100 | $206,400 | $132,700 |
| 2015 | $4,537 | $328,300 | $206,400 | $121,900 |
Source: Public Records
Map
Nearby Homes