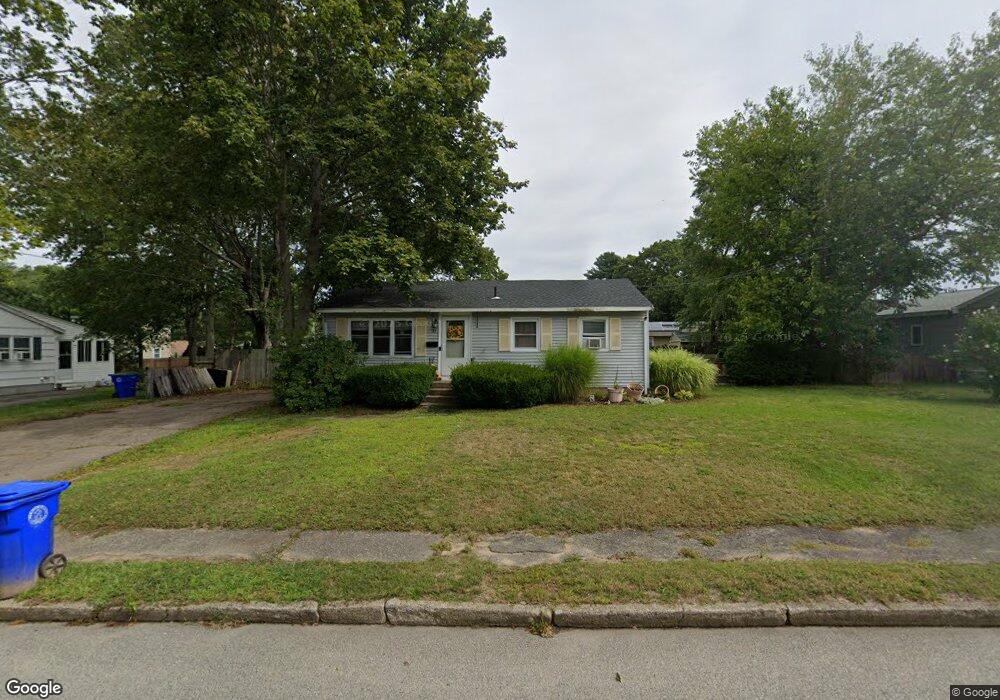
33 Foley Rd Rockland, MA 02370
Estimated Value: $476,000 - $511,000
3
Beds
2
Baths
864
Sq Ft
$570/Sq Ft
Est. Value
About This Home
This home is located at 33 Foley Rd, Rockland, MA 02370 and is currently estimated at $492,458, approximately $569 per square foot. 33 Foley Rd is a home located in Plymouth County with nearby schools including Rockland Senior High School, St Bridget School, and Calvary Chapel Academy.
Ownership History
Date
Name
Owned For
Owner Type
Purchase Details
Closed on
Jul 27, 1987
Sold by
Bickford Arthur L
Bought by
Loughlin Michael T
Current Estimated Value
Home Financials for this Owner
Home Financials are based on the most recent Mortgage that was taken out on this home.
Original Mortgage
$116,900
Interest Rate
10.67%
Mortgage Type
Purchase Money Mortgage
Create a Home Valuation Report for This Property
The Home Valuation Report is an in-depth analysis detailing your home's value as well as a comparison with similar homes in the area
Home Values in the Area
Average Home Value in this Area
Purchase History
| Date | Buyer | Sale Price | Title Company |
|---|---|---|---|
| Loughlin Michael T | $129,900 | -- |
Source: Public Records
Mortgage History
| Date | Status | Borrower | Loan Amount |
|---|---|---|---|
| Closed | Loughlin Michael T | $112,000 | |
| Closed | Loughlin Michael T | $116,900 |
Source: Public Records
Tax History Compared to Growth
Tax History
| Year | Tax Paid | Tax Assessment Tax Assessment Total Assessment is a certain percentage of the fair market value that is determined by local assessors to be the total taxable value of land and additions on the property. | Land | Improvement |
|---|---|---|---|---|
| 2025 | $5,743 | $420,100 | $225,200 | $194,900 |
| 2024 | $5,573 | $396,400 | $212,400 | $184,000 |
| 2023 | $5,539 | $363,900 | $194,900 | $169,000 |
| 2022 | $5,335 | $318,500 | $169,400 | $149,100 |
| 2021 | $16,357 | $284,600 | $154,000 | $130,600 |
| 2020 | $15,494 | $271,100 | $146,700 | $124,400 |
| 2019 | $4,632 | $258,500 | $139,800 | $118,700 |
| 2018 | $15,763 | $236,500 | $139,800 | $96,700 |
| 2017 | $4,210 | $227,800 | $139,800 | $88,000 |
| 2016 | $4,051 | $219,100 | $134,400 | $84,700 |
| 2015 | $3,875 | $203,600 | $125,600 | $78,000 |
| 2014 | $3,664 | $199,800 | $123,200 | $76,600 |
Source: Public Records
Map
Nearby Homes
- 5 Clark Rd
- 225 W Water St
- 15 Thayer Terrace
- 119 Grove St Unit 223
- 119 Grove St Unit 238
- 103 Grove St Unit 337
- 140 W Water St
- 59 Spring St
- 46 Wardson Cir
- 340 Centre Ave Unit 54
- 23 Payson Ave
- 88 Willow Pond Dr
- 122 Reed St
- 96 Plymouth St
- 925 Washington St
- 11 Chestnut Cir
- 800 Plymouth St
- 6 Chestnut Cir
- 38 Lantern Ln
- 20 Birch St