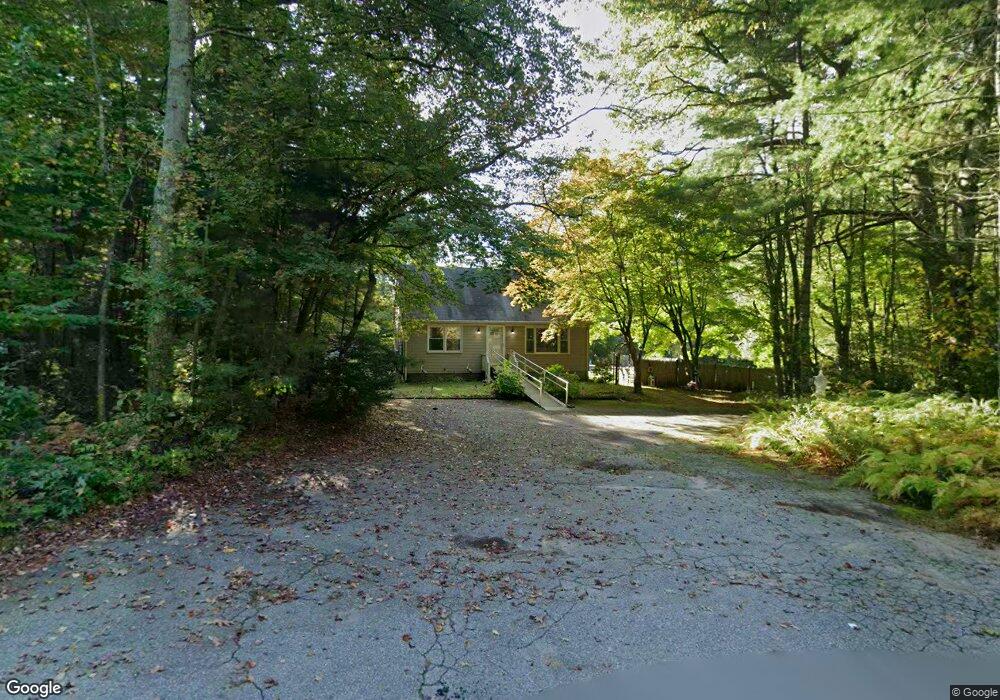
33 French St Rehoboth, MA 02769
Estimated Value: $524,380 - $668,000
4
Beds
1
Bath
1,572
Sq Ft
$372/Sq Ft
Est. Value
About This Home
This home is located at 33 French St, Rehoboth, MA 02769 and is currently estimated at $585,095, approximately $372 per square foot. 33 French St is a home located in Bristol County with nearby schools including Dighton-Rehoboth Regional High School and Cedar Brook School.
Ownership History
Date
Name
Owned For
Owner Type
Purchase Details
Closed on
Dec 18, 1995
Sold by
Goulart Manuel S and Goulart Maria F
Bought by
Ennis Edward J and Goularts Suzanne
Current Estimated Value
Home Financials for this Owner
Home Financials are based on the most recent Mortgage that was taken out on this home.
Original Mortgage
$117,308
Outstanding Balance
$2,414
Interest Rate
7.43%
Mortgage Type
Purchase Money Mortgage
Estimated Equity
$582,681
Create a Home Valuation Report for This Property
The Home Valuation Report is an in-depth analysis detailing your home's value as well as a comparison with similar homes in the area
Home Values in the Area
Average Home Value in this Area
Purchase History
| Date | Buyer | Sale Price | Title Company |
|---|---|---|---|
| Ennis Edward J | $125,000 | -- |
Source: Public Records
Mortgage History
| Date | Status | Borrower | Loan Amount |
|---|---|---|---|
| Open | Ennis Edward J | $117,308 | |
| Previous Owner | Ennis Edward J | $15,000 |
Source: Public Records
Tax History Compared to Growth
Tax History
| Year | Tax Paid | Tax Assessment Tax Assessment Total Assessment is a certain percentage of the fair market value that is determined by local assessors to be the total taxable value of land and additions on the property. | Land | Improvement |
|---|---|---|---|---|
| 2025 | $44 | $396,700 | $186,500 | $210,200 |
| 2024 | $4,559 | $401,300 | $221,100 | $180,200 |
| 2023 | $4,564 | $394,100 | $216,700 | $177,400 |
| 2022 | $4,272 | $337,200 | $199,800 | $137,400 |
| 2021 | $13,291 | $327,500 | $183,200 | $144,300 |
| 2020 | $4,343 | $331,000 | $191,200 | $139,800 |
| 2018 | $3,608 | $301,400 | $182,700 | $118,700 |
| 2017 | $3,596 | $286,300 | $182,700 | $103,600 |
| 2016 | $3,516 | $289,400 | $190,300 | $99,100 |
| 2015 | $3,693 | $300,000 | $182,100 | $117,900 |
| 2014 | $3,527 | $283,500 | $173,800 | $109,700 |
Source: Public Records
Map
Nearby Homes
- 0 Winter St
- 20 School St
- 67 Wheeler St
- 111 Summer St
- 198 Brook St
- 23 Colonial Way
- 8 Linden Ln
- 8 Linden Ln
- 37 Colonial Way
- 205 Providence St Bldr Lot 3
- 203 Providence St Bldr Lot 5
- 9 Hidden Hills Dr
- 32 Providence St
- 6 Running Stream Rd
- 63 Moulton St
- 15 Hickory Ridge Rd
- 267 Chestnut St
- 42 Linden Ln
- 206 Moulton St
- 248 County