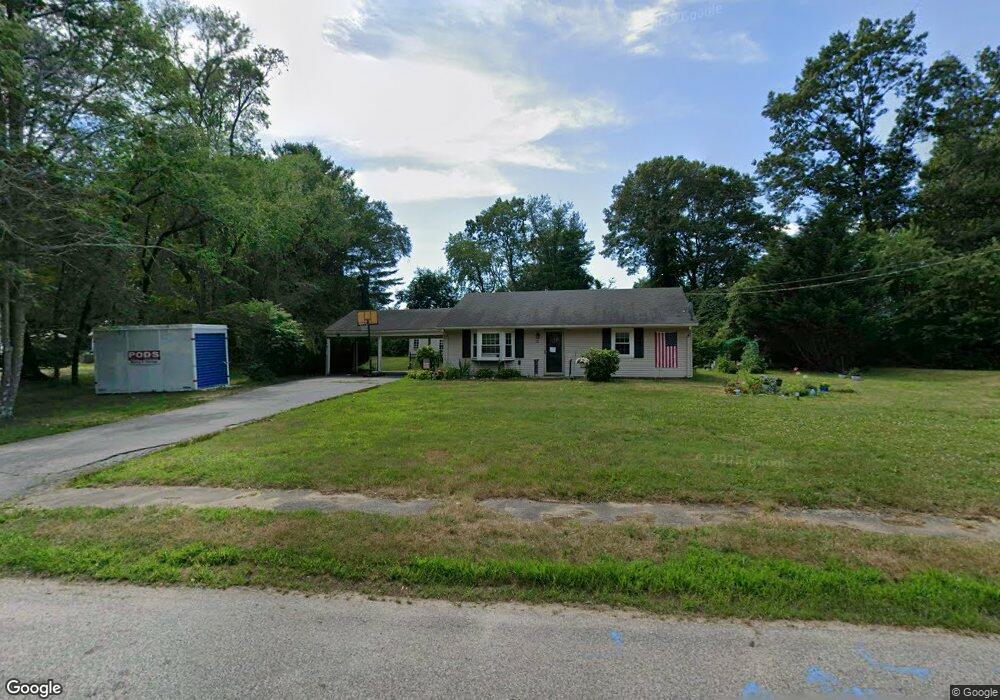
33 Frisbie Rd Marshfield, MA 02050
Estimated Value: $578,422 - $694,000
3
Beds
1
Bath
1,008
Sq Ft
$627/Sq Ft
Est. Value
About This Home
This home is located at 33 Frisbie Rd, Marshfield, MA 02050 and is currently estimated at $632,106, approximately $627 per square foot. 33 Frisbie Rd is a home located in Plymouth County with nearby schools including Daniel Webster, Furnace Brook Middle School, and Marshfield High School.
Ownership History
Date
Name
Owned For
Owner Type
Purchase Details
Closed on
Dec 23, 2004
Sold by
Fay Ruth F
Bought by
Mccormick Shawn M and White Erica K
Current Estimated Value
Home Financials for this Owner
Home Financials are based on the most recent Mortgage that was taken out on this home.
Original Mortgage
$264,000
Outstanding Balance
$132,299
Interest Rate
5.74%
Mortgage Type
Purchase Money Mortgage
Estimated Equity
$499,807
Create a Home Valuation Report for This Property
The Home Valuation Report is an in-depth analysis detailing your home's value as well as a comparison with similar homes in the area
Home Values in the Area
Average Home Value in this Area
Purchase History
| Date | Buyer | Sale Price | Title Company |
|---|---|---|---|
| Mccormick Shawn M | $330,000 | -- |
Source: Public Records
Mortgage History
| Date | Status | Borrower | Loan Amount |
|---|---|---|---|
| Open | Mccormick Shawn M | $62,145 | |
| Open | Mccormick Shawn M | $264,000 | |
| Closed | Mccormick Shawn M | $66,000 |
Source: Public Records
Tax History Compared to Growth
Tax History
| Year | Tax Paid | Tax Assessment Tax Assessment Total Assessment is a certain percentage of the fair market value that is determined by local assessors to be the total taxable value of land and additions on the property. | Land | Improvement |
|---|---|---|---|---|
| 2025 | $4,636 | $468,300 | $306,600 | $161,700 |
| 2024 | $4,544 | $437,300 | $292,000 | $145,300 |
| 2023 | $4,283 | $394,600 | $260,700 | $133,900 |
| 2022 | $4,283 | $330,700 | $219,000 | $111,700 |
| 2021 | $4,246 | $321,900 | $219,000 | $102,900 |
| 2020 | $3,987 | $299,100 | $198,100 | $101,000 |
| 2019 | $3,859 | $288,400 | $198,100 | $90,300 |
| 2018 | $3,817 | $285,500 | $198,100 | $87,400 |
| 2017 | $3,811 | $277,800 | $198,100 | $79,700 |
| 2016 | $3,748 | $270,000 | $198,100 | $71,900 |
| 2015 | $3,511 | $264,200 | $198,100 | $66,100 |
| 2014 | $3,475 | $261,500 | $198,100 | $63,400 |
Source: Public Records
Map
Nearby Homes
- 30 Chandler Dr
- 92 Salt Meadow Waye
- 1801 Ocean St Unit B31
- 311 S River St
- 32 Gratto Rd
- 8 Duxbury St
- 713 Webster St
- 39 High Beacon Way
- 11 Leon St
- 90 Presidential Cir
- 235 Main St
- 480 Ferry St
- 431 Moraine St
- 566 Holly Rd
- 24 Second (2nd) Rd
- 184 King Phillips Pathe
- 19 2nd Rd
- 255 Ridge Rd
- 5 Adelaide Way
- 341 Furnace St