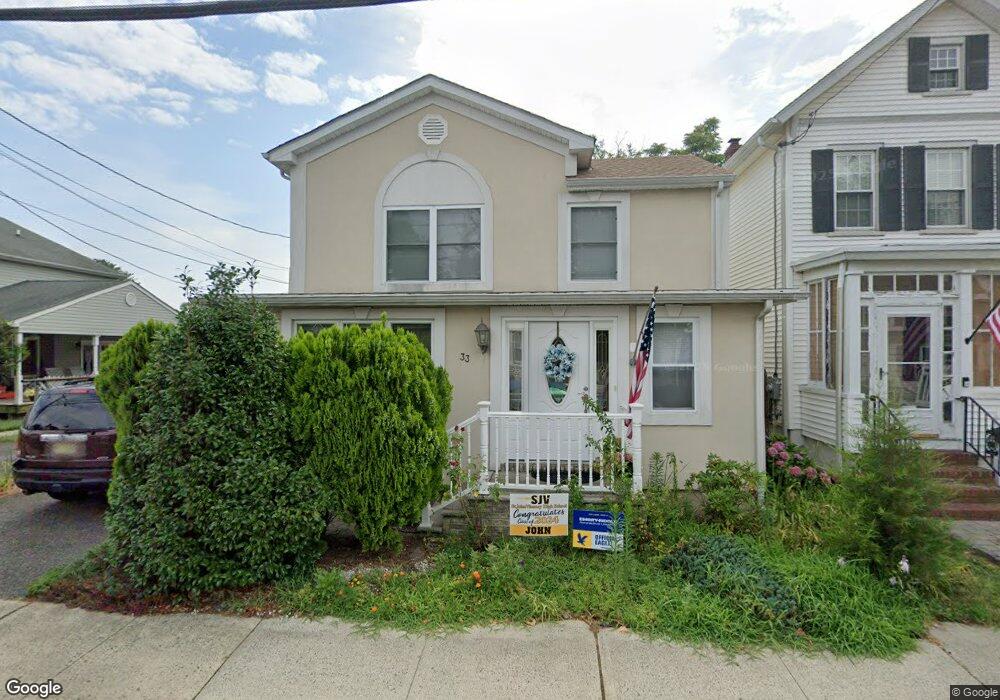
33 Fulton St Keyport, NJ 07735
Estimated Value: $516,633 - $566,000
3
Beds
2
Baths
2,016
Sq Ft
$269/Sq Ft
Est. Value
About This Home
This home is located at 33 Fulton St, Keyport, NJ 07735 and is currently estimated at $542,408, approximately $269 per square foot. 33 Fulton St is a home located in Monmouth County with nearby schools including Keyport Central School, Keyport High School, and Icob Academy.
Ownership History
Date
Name
Owned For
Owner Type
Purchase Details
Closed on
Feb 12, 2002
Sold by
Martinez Mell
Bought by
Trojacki Tomasz and Trojacki Katarzyna
Current Estimated Value
Home Financials for this Owner
Home Financials are based on the most recent Mortgage that was taken out on this home.
Original Mortgage
$137,550
Interest Rate
6.92%
Purchase Details
Closed on
Mar 25, 1996
Sold by
Buck Donald
Bought by
Kasauskas Povilas
Home Financials for this Owner
Home Financials are based on the most recent Mortgage that was taken out on this home.
Original Mortgage
$78,000
Interest Rate
7.39%
Mortgage Type
FHA
Create a Home Valuation Report for This Property
The Home Valuation Report is an in-depth analysis detailing your home's value as well as a comparison with similar homes in the area
Home Values in the Area
Average Home Value in this Area
Purchase History
| Date | Buyer | Sale Price | Title Company |
|---|---|---|---|
| Trojacki Tomasz | $110,700 | -- | |
| Kasauskas Povilas | $40,100 | -- |
Source: Public Records
Mortgage History
| Date | Status | Borrower | Loan Amount |
|---|---|---|---|
| Previous Owner | Trojacki Tomasz | $137,550 | |
| Previous Owner | Kasauskas Povilas | $78,000 |
Source: Public Records
Tax History Compared to Growth
Tax History
| Year | Tax Paid | Tax Assessment Tax Assessment Total Assessment is a certain percentage of the fair market value that is determined by local assessors to be the total taxable value of land and additions on the property. | Land | Improvement |
|---|---|---|---|---|
| 2025 | $8,435 | $456,300 | $176,600 | $279,700 |
| 2024 | $8,348 | $407,500 | $141,600 | $265,900 |
| 2023 | $8,348 | $379,800 | $128,700 | $251,100 |
| 2022 | $7,231 | $330,100 | $111,900 | $218,200 |
| 2021 | $7,231 | $286,500 | $97,300 | $189,200 |
| 2020 | $6,899 | $271,300 | $91,400 | $179,900 |
| 2019 | $6,695 | $263,700 | $87,900 | $175,800 |
| 2018 | $6,386 | $245,600 | $81,100 | $164,500 |
| 2017 | $6,648 | $255,000 | $82,900 | $172,100 |
| 2016 | $6,553 | $253,500 | $82,900 | $170,600 |
| 2015 | $6,394 | $246,200 | $77,900 | $168,300 |
| 2014 | $6,042 | $234,900 | $52,900 | $182,000 |
Source: Public Records
Map
Nearby Homes
- 162 2nd St
- 37 Myrtle Ave
- 14 Cedar St
- 74 Manchester Ave
- 72 Manchester Ave
- 48 Pine St
- 87 Church St
- 209 Broadway
- 25-27 Brook Ave
- 40 Church St
- 226 Osborn St
- 195 Atlantic St
- 2108 Florence Ave
- 233 Broadway
- 3 Julia Ln
- 231 Atlantic St Unit 23
- 17 Green Tree Cir
- 9 Monmouth Place
- 819 Saint John's Ave
- 788 Poole Ave