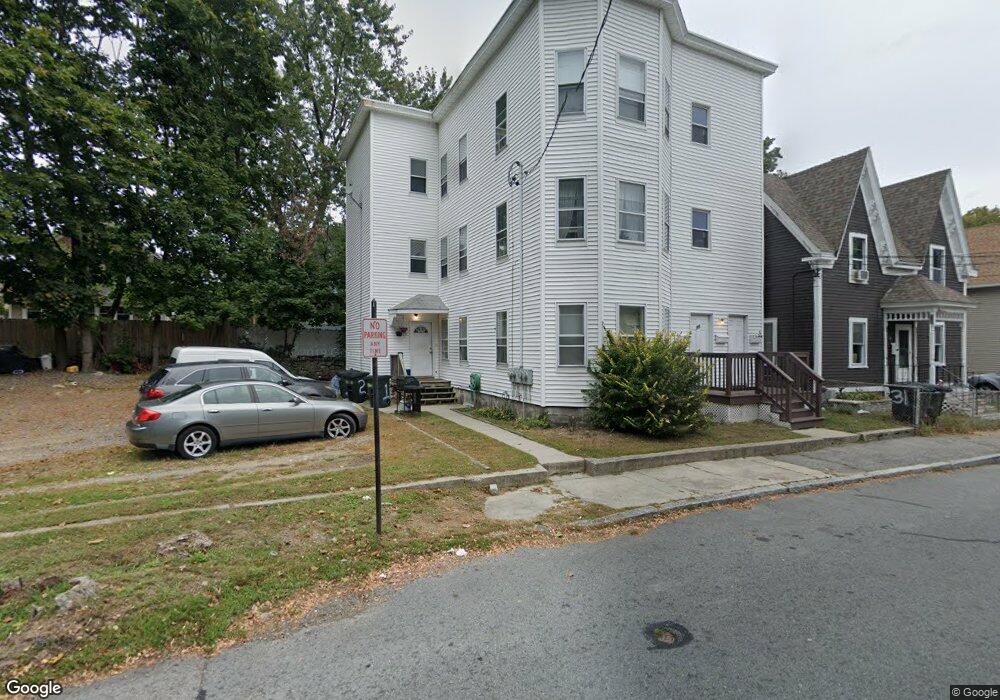
33 Gill Ave Unit 35 Methuen, MA 01844
Downtown Methuen NeighborhoodEstimated Value: $770,000 - $865,000
9
Beds
3
Baths
3,500
Sq Ft
$231/Sq Ft
Est. Value
About This Home
This home is located at 33 Gill Ave Unit 35, Methuen, MA 01844 and is currently estimated at $807,000, approximately $230 per square foot. 33 Gill Ave Unit 35 is a home located in Essex County with nearby schools including Marsh Grammar School, South Point Elementary School, and Methuen High School.
Ownership History
Date
Name
Owned For
Owner Type
Purchase Details
Closed on
Nov 7, 2016
Sold by
Dana Walsh Ret and Lex
Bought by
Debra S Lex Ret and Lex
Current Estimated Value
Purchase Details
Closed on
Nov 20, 2012
Sold by
Walsh Dana A
Bought by
Dana A Walsh Ret and Walsh
Purchase Details
Closed on
May 31, 1995
Sold by
Llm Rt
Bought by
Walsh Dana A
Purchase Details
Closed on
Oct 15, 1992
Sold by
Barker Street Trust
Bought by
Thomas Leonard J
Purchase Details
Closed on
Sep 14, 1992
Sold by
National Mtg Co Inc
Bought by
Klier Bruce W
Purchase Details
Closed on
Jul 29, 1992
Sold by
Countrywide Funding Co
Bought by
National Mtg Co Inc
Create a Home Valuation Report for This Property
The Home Valuation Report is an in-depth analysis detailing your home's value as well as a comparison with similar homes in the area
Home Values in the Area
Average Home Value in this Area
Purchase History
| Date | Buyer | Sale Price | Title Company |
|---|---|---|---|
| Debra S Lex Ret | -- | -- | |
| Debra S Lex Ret | -- | -- | |
| Debra S Lex Ret | -- | -- | |
| Dana A Walsh Ret | -- | -- | |
| Dana A Walsh Ret | -- | -- | |
| Walsh Dana A | $98,400 | -- | |
| Walsh Dana A | $98,400 | -- | |
| Thomas Leonard J | $50,250 | -- | |
| Barker Street Trust | $5,000 | -- | |
| Barker Street Trust | $5,000 | -- | |
| Klier Bruce W | $5,000 | -- | |
| Klier Bruce W | $5,000 | -- | |
| National Mtg Co Inc | $101,250 | -- | |
| National Mtg Co Inc | $101,250 | -- |
Source: Public Records
Mortgage History
| Date | Status | Borrower | Loan Amount |
|---|---|---|---|
| Previous Owner | National Mtg Co Inc | $180,000 | |
| Previous Owner | National Mtg Co Inc | $75,000 |
Source: Public Records
Tax History Compared to Growth
Tax History
| Year | Tax Paid | Tax Assessment Tax Assessment Total Assessment is a certain percentage of the fair market value that is determined by local assessors to be the total taxable value of land and additions on the property. | Land | Improvement |
|---|---|---|---|---|
| 2025 | $6,697 | $633,000 | $187,600 | $445,400 |
| 2024 | $6,616 | $609,200 | $171,100 | $438,100 |
| 2023 | $6,322 | $540,300 | $152,100 | $388,200 |
| 2022 | $5,583 | $427,800 | $120,400 | $307,400 |
| 2021 | $5,463 | $414,200 | $114,100 | $300,100 |
| 2020 | $5,469 | $406,900 | $114,100 | $292,800 |
| 2019 | $4,853 | $342,000 | $86,200 | $255,800 |
| 2018 | $4,474 | $313,500 | $81,100 | $232,400 |
| 2017 | $4,249 | $290,000 | $81,100 | $208,900 |
| 2016 | $3,914 | $264,300 | $71,000 | $193,300 |
| 2015 | $3,516 | $240,800 | $71,000 | $169,800 |
Source: Public Records
Map
Nearby Homes
- 20-22 Ashland Ave
- 24 Railroad St
- 83 Arnold St
- 23 Chase St
- 2 Horne St
- 47 Lowell St
- 35 Hardy St
- 69 Broadway
- 190-192 Oakland Ave
- 17-19 Maplewood Ave
- 100-102 Phillips St
- 37 Maplewood Ave
- 8 Francella Rd
- 52 High St Unit 5
- 206-208 Willow St
- 179-181 West St
- 18 Larchwood Rd
- 26 Gage St
- 2 Lawrence St
- 364 Lawrence St
- 31 Gill Ave
- 24 Ashland Ave Unit 26
- 24 Ashland Ave
- 28 Ashland Ave
- 29 Gill Ave
- 22 Ashland Ave Unit 1
- 20 Ashland Ave Unit 2
- 20 Ashland Ave Unit 1
- 22 Ashland Ave
- 20 Ashland Ave
- 16-18 Ashland Ave
- 16 Ashland Ave Unit 18
- 16 Ashland Ave Unit 1
- 30 Ashland Ave Unit 32
- 25 Gill Ave Unit 27
- 14 Ashland Ave
- 38-40 Ashland Ave Unit 1
- 40 Ashland Ave Unit 1
- 40 Ashland Ave Unit 2
- 40 Ashland Ave Unit 3