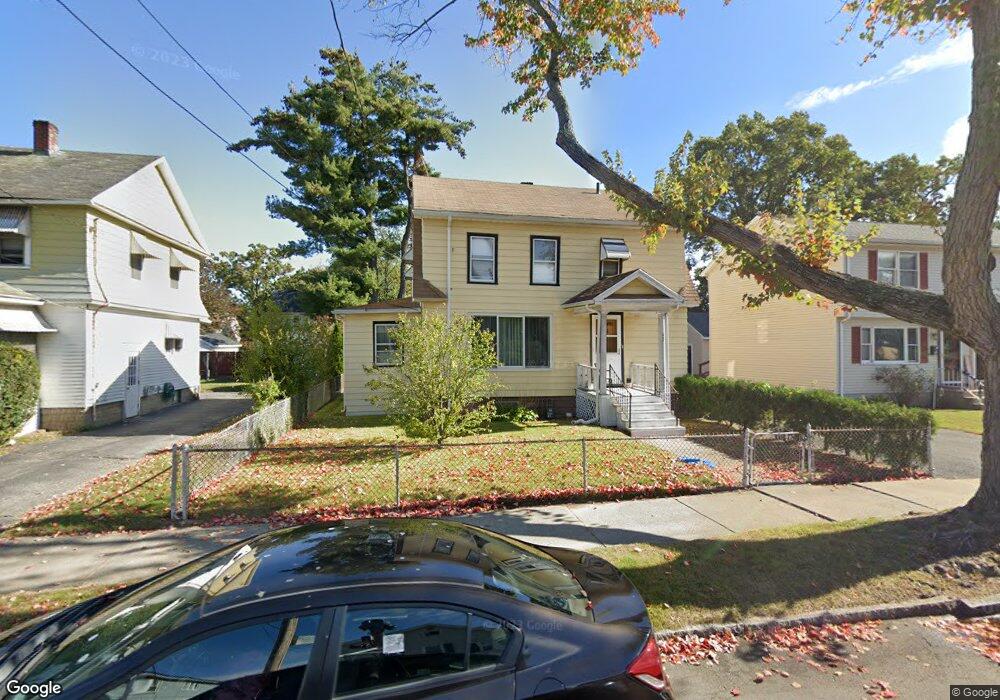
33 Glenham St Springfield, MA 01104
Liberty Heights NeighborhoodEstimated Value: $236,000 - $390,000
3
Beds
2
Baths
1,560
Sq Ft
$207/Sq Ft
Est. Value
About This Home
This home is located at 33 Glenham St, Springfield, MA 01104 and is currently estimated at $322,257, approximately $206 per square foot. 33 Glenham St is a home located in Hampden County with nearby schools including Mary O. Pottenger Elementary School, Van Sickle Academy, and Springfield Central High School.
Ownership History
Date
Name
Owned For
Owner Type
Purchase Details
Closed on
Sep 29, 2000
Sold by
Smith Patrick G and Smith Sheila M
Bought by
Brace Olivia L
Current Estimated Value
Home Financials for this Owner
Home Financials are based on the most recent Mortgage that was taken out on this home.
Original Mortgage
$55,850
Outstanding Balance
$20,397
Interest Rate
7.94%
Mortgage Type
Purchase Money Mortgage
Estimated Equity
$301,860
Purchase Details
Closed on
Jun 21, 1994
Sold by
United Coop Bk
Bought by
Smith Patrick G and Smith Shiela M
Home Financials for this Owner
Home Financials are based on the most recent Mortgage that was taken out on this home.
Original Mortgage
$55,675
Interest Rate
8.5%
Mortgage Type
Purchase Money Mortgage
Purchase Details
Closed on
Jan 15, 1993
Sold by
Azevedo Octavio S
Bought by
United Coop Bk
Purchase Details
Closed on
May 11, 1988
Sold by
Cherry Barbara Jean
Bought by
Azevedo Octavio S
Create a Home Valuation Report for This Property
The Home Valuation Report is an in-depth analysis detailing your home's value as well as a comparison with similar homes in the area
Home Values in the Area
Average Home Value in this Area
Purchase History
| Date | Buyer | Sale Price | Title Company |
|---|---|---|---|
| Brace Olivia L | $74,500 | -- | |
| Smith Patrick G | $65,500 | -- | |
| United Coop Bk | $72,000 | -- | |
| Azevedo Octavio S | $134,900 | -- |
Source: Public Records
Mortgage History
| Date | Status | Borrower | Loan Amount |
|---|---|---|---|
| Open | Azevedo Octavio S | $55,850 | |
| Previous Owner | Azevedo Octavio S | $55,675 | |
| Closed | Azevedo Octavio S | $14,900 |
Source: Public Records
Tax History
| Year | Tax Paid | Tax Assessment Tax Assessment Total Assessment is a certain percentage of the fair market value that is determined by local assessors to be the total taxable value of land and additions on the property. | Land | Improvement |
|---|---|---|---|---|
| 2025 | $3,809 | $242,900 | $37,600 | $205,300 |
| 2024 | $3,834 | $238,700 | $37,600 | $201,100 |
| 2023 | $3,725 | $218,500 | $33,200 | $185,300 |
| 2022 | $3,213 | $170,700 | $31,100 | $139,600 |
| 2021 | $2,912 | $154,100 | $28,300 | $125,800 |
| 2020 | $2,797 | $143,200 | $28,300 | $114,900 |
| 2019 | $2,848 | $144,700 | $30,700 | $114,000 |
| 2018 | $2,653 | $134,800 | $30,700 | $104,100 |
| 2017 | $2,623 | $133,400 | $27,800 | $105,600 |
| 2016 | $2,601 | $132,300 | $26,300 | $106,000 |
| 2015 | $2,197 | $111,700 | $26,300 | $85,400 |
Source: Public Records
Map
Nearby Homes
- 49 Upland St
- 73 Melville
- 47 Victoria St
- 150 Drexel St
- 59 Piedmont St
- 143 Saint James Cir
- 28 Porter St
- 83 Oklahoma St
- 42 Marquette St
- 102 San Miguel St
- 33 Drexel St
- 47 Holy Cross St
- 27 Parallel St
- 151 Littleton St
- 200 El Paso St
- 119 Littleton St
- 9 Utica St
- 491-493 Newbury St
- 44 Naismith St
- 158 Monrovia St
- 27 Glenham St
- 37 Glenham St Unit 39
- 37-39 Glenham St
- 23 Glenham St
- 43 Glenham St
- 40 Carew Terrace
- 34 Carew Terrace
- 44 Carew Terrace
- 32 Glenham St Unit 34
- 19 Glenham St
- 49 Glenham St
- 28 Glenham St Unit 30
- 28-30 Glenham St
- 30 Carew Terrace
- 38 Glenham St Unit 40
- 50 Carew Terrace
- 22 Glenham St
- 44 Glenham St
- 24 Carew Terrace
- 54 Carew Terrace Unit 56
Your Personal Tour Guide
Ask me questions while you tour the home.