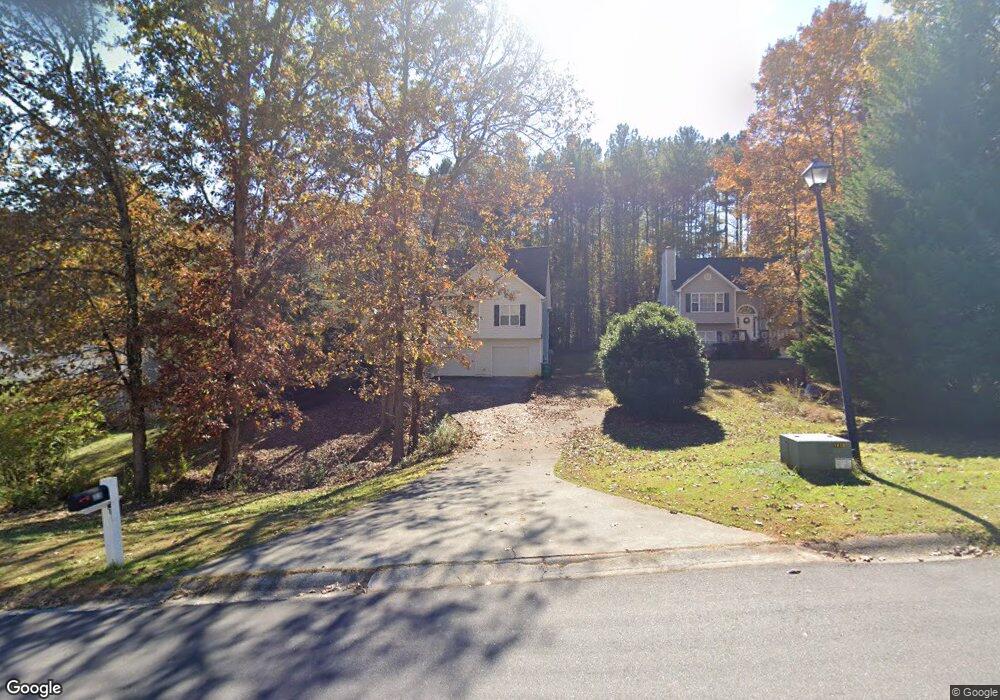
33 Gold Creek Dr Unit 7 Tallapoosa, GA 30176
Estimated Value: $259,000 - $311,000
4
Beds
3
Baths
1,238
Sq Ft
$229/Sq Ft
Est. Value
About This Home
This home is located at 33 Gold Creek Dr Unit 7, Tallapoosa, GA 30176 and is currently estimated at $284,063, approximately $229 per square foot. 33 Gold Creek Dr Unit 7 is a home located in Haralson County with nearby schools including Haralson County High School.
Ownership History
Date
Name
Owned For
Owner Type
Purchase Details
Closed on
Apr 19, 2017
Sold by
Wade William H
Bought by
Torrance Charles B
Current Estimated Value
Home Financials for this Owner
Home Financials are based on the most recent Mortgage that was taken out on this home.
Original Mortgage
$98,297
Outstanding Balance
$81,843
Interest Rate
4.23%
Mortgage Type
New Conventional
Estimated Equity
$202,220
Purchase Details
Closed on
Dec 30, 2010
Sold by
Chamblee Associates Llc
Bought by
Wade William H
Home Financials for this Owner
Home Financials are based on the most recent Mortgage that was taken out on this home.
Original Mortgage
$98,601
Interest Rate
4.48%
Mortgage Type
New Conventional
Purchase Details
Closed on
Aug 6, 2002
Sold by
Elb Homes Inc
Bought by
Chamblee Associates Llc
Purchase Details
Closed on
Jun 22, 2001
Sold by
Chamblee Associates Llc
Bought by
Elb Homes Inc
Purchase Details
Closed on
Aug 31, 1998
Bought by
Chamblee Associates
Create a Home Valuation Report for This Property
The Home Valuation Report is an in-depth analysis detailing your home's value as well as a comparison with similar homes in the area
Home Values in the Area
Average Home Value in this Area
Purchase History
| Date | Buyer | Sale Price | Title Company |
|---|---|---|---|
| Torrance Charles B | $95,000 | -- | |
| Wade William H | $97,429 | -- | |
| Wade William H | $97,429 | -- | |
| Chamblee Associates Llc | $95,500 | -- | |
| Elb Homes Inc | -- | -- | |
| Elb Homes Inc | $19,500 | -- | |
| Chamblee Associates | -- | -- |
Source: Public Records
Mortgage History
| Date | Status | Borrower | Loan Amount |
|---|---|---|---|
| Open | Torrance Charles B | $98,297 | |
| Previous Owner | Wade William H | $98,601 |
Source: Public Records
Tax History Compared to Growth
Tax History
| Year | Tax Paid | Tax Assessment Tax Assessment Total Assessment is a certain percentage of the fair market value that is determined by local assessors to be the total taxable value of land and additions on the property. | Land | Improvement |
|---|---|---|---|---|
| 2024 | $2,343 | $75,967 | $5,088 | $70,879 |
| 2023 | $2,533 | $79,011 | $4,800 | $74,211 |
| 2022 | $1,428 | $57,310 | $4,800 | $52,510 |
| 2021 | $1,402 | $54,013 | $4,800 | $49,213 |
| 2020 | $1,301 | $50,105 | $4,800 | $45,305 |
| 2019 | $1,042 | $39,128 | $4,800 | $34,328 |
| 2018 | $1,068 | $37,616 | $4,800 | $32,816 |
| 2017 | $1,288 | $41,374 | $4,800 | $36,574 |
| 2016 | $931 | $31,959 | $4,800 | $27,159 |
| 2015 | $1,066 | $36,372 | $4,800 | $31,572 |
| 2014 | $1,348 | $39,567 | $4,800 | $34,767 |
Source: Public Records
Map
Nearby Homes
- Tract1 Georgia 100
- Tract5 Georgia 100
- Tract2 Georgia 100
- 1744 Georgia 100
- 281 Lowell Allen Rd
- 610 Old Pleasant Hill Rd
- 280 Levi-Patterson Rd
- 1844 Old Highway 100
- 6919 Mount Zion Rd
- 1219 Old Highway 100
- 0 Budapest Rd Unit 1522426
- 967 Old Highway 100
- 0 Highway 100 Unit 10465102
- 912 Golf Course Rd
- 2659 Jacksonville Rd
- 419 Lively Rd
- 415 Lively Rd
- 3765 U S 78
- 400 Kelley Rd
- 33 Gold Creek Dr
- 43 Gold Creek Dr
- 23 Gold Creek Dr
- 53 Gold Creek Dr
- 30 Gold Creek Dr
- 40 Gold Creek Dr
- 50 Gold Creek Dr
- 20 Gold Creek Dr
- 63 Gold Creek Dr
- 60 Gold Creek Dr
- 0 Gold Creek Dr Unit 10009689
- 0 Gold Creek Dr Unit 6983047
- 0 Gold Creek Dr Unit 8650384
- 0 Gold Creek Dr Unit 8600504
- 0 Gold Creek Dr Unit 8499071
- 0 Gold Creek Dr Unit 8465785
- 0 Gold Creek Dr Unit 8437058
- 0 Gold Creek Dr Unit 9073419
- 0 Gold Creek Dr Unit 6963049
- 0 Gold Creek Dr Unit 9045143