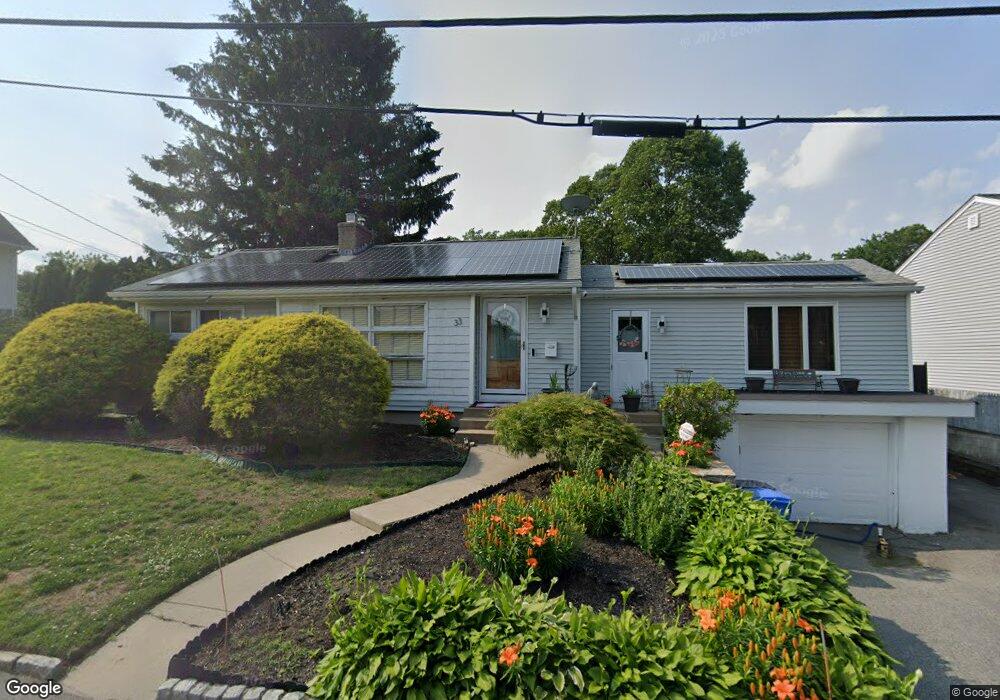
33 Gordon St Cranston, RI 02910
Spectacle NeighborhoodEstimated Value: $359,000 - $389,529
About This Home
This home is located at 33 Gordon St, Cranston, RI 02910 and is currently estimated at $380,882, approximately $347 per square foot. 33 Gordon St is a home located in Providence County with nearby schools including Stadium Elementary School, Hugh B. Bain Middle School, and Cranston High School East.
Ownership History
We collect this data history from publicly available records. To have your information removed, we recommend requesting removal directly through your county’s website.
Purchase Details
Home Financials for this Owner
Home Financials are based on the most recent Mortgage that was taken out on this home.Home Values in the Area
Average Home Value in this Area
Purchase History
We collect this data history from publicly available records. To have your information removed, we recommend requesting removal directly through your county’s website.
| Date | Buyer | Sale Price | Title Company |
|---|---|---|---|
| $200,000 | -- |
Mortgage History
We collect this data history from publicly available records. To have your information removed, we recommend requesting removal directly through your county’s website.
| Date | Status | Borrower | Loan Amount |
|---|---|---|---|
| Open | $200,000 | ||
| Previous Owner | $50,000 | ||
| Previous Owner | $110,000 |
Tax History
We collect this data history from publicly available records. To have your information removed, we recommend requesting removal directly through your county’s website.
| Year | Tax Paid | Tax Assessment Tax Assessment Total Assessment is a certain percentage of the fair market value that is determined by local assessors to be the total taxable value of land and additions on the property. | Land | Improvement |
|---|---|---|---|---|
| 2025 | $4,208 | $303,200 | $99,700 | $203,500 |
| 2024 | $4,127 | $303,200 | $99,700 | $203,500 |
| 2023 | $4,266 | $225,700 | $75,600 | $150,100 |
| 2022 | $4,178 | $225,700 | $75,600 | $150,100 |
| 2021 | $4,063 | $225,700 | $75,600 | $150,100 |
| 2020 | $3,861 | $185,900 | $71,800 | $114,100 |
| 2019 | $3,861 | $185,900 | $71,800 | $114,100 |
| 2018 | $3,772 | $185,900 | $71,800 | $114,100 |
| 2017 | $3,434 | $149,700 | $52,900 | $96,800 |
| 2016 | $3,361 | $149,700 | $52,900 | $96,800 |
| 2015 | $3,361 | $149,700 | $52,900 | $96,800 |
| 2014 | $3,294 | $144,200 | $52,900 | $91,300 |
Map
- 60 Lowell St
- 11 Doane St
- 25 Doane St
- 76 Sabra St
- 8 Arlington Ave Unit 10
- 11 Swanton St
- 6 Tobyhanna St
- 1250 Cranston St
- 44 Pavilion Ave
- 1040 Cranston St
- 33 Ridge St
- 2 Gansett Ave
- 17 Caporal St
- 26 Westmore St
- 50 Pendleton St
- 85 Fiat Ave
- 179 Jordan Ave
- 18 Standish Ave
- 79 Chestnut Hill Ave
- 110 Westcott Ave
Ask me questions while you tour the home.