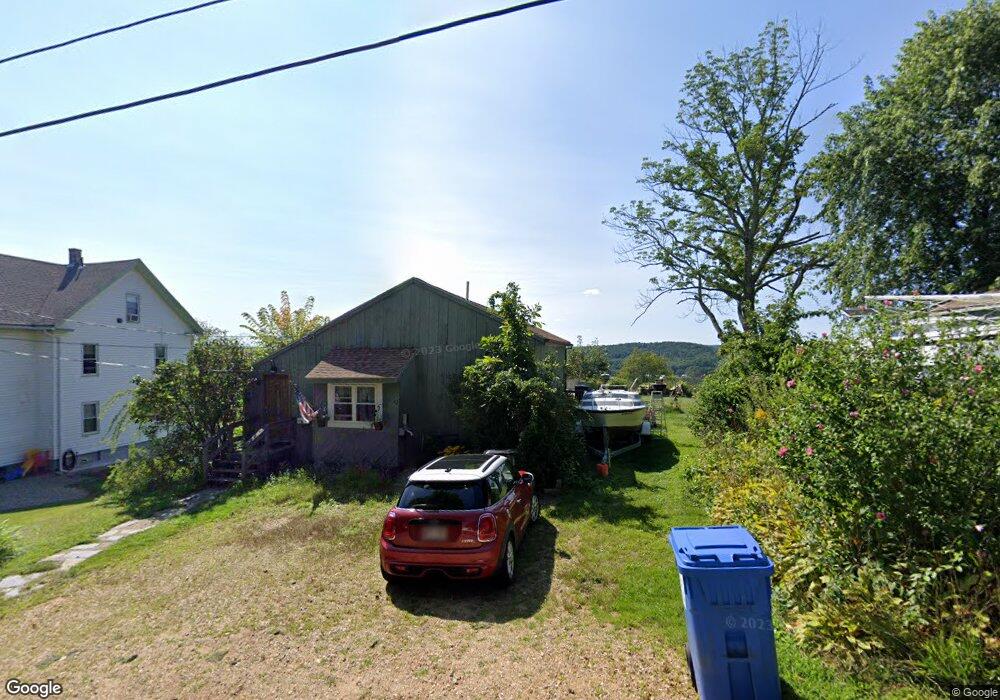
33 Grant St Spencer, MA 01562
Estimated Value: $303,000 - $387,000
1
Bed
1
Bath
1,500
Sq Ft
$234/Sq Ft
Est. Value
About This Home
This home is located at 33 Grant St, Spencer, MA 01562 and is currently estimated at $351,342, approximately $234 per square foot. 33 Grant St is a home located in Worcester County with nearby schools including David Prouty High School.
Ownership History
Date
Name
Owned For
Owner Type
Purchase Details
Closed on
Feb 22, 2024
Sold by
Duquette Sherri L
Bought by
Duquette Michael A and Duquette Sherri L
Current Estimated Value
Home Financials for this Owner
Home Financials are based on the most recent Mortgage that was taken out on this home.
Original Mortgage
$30,000
Outstanding Balance
$29,735
Interest Rate
6.66%
Mortgage Type
Credit Line Revolving
Estimated Equity
$321,607
Purchase Details
Closed on
May 27, 2010
Sold by
Renauld Michelle M and Renauld Ronald F
Bought by
Duquette Sherri L
Home Financials for this Owner
Home Financials are based on the most recent Mortgage that was taken out on this home.
Original Mortgage
$148,006
Interest Rate
5.13%
Mortgage Type
Purchase Money Mortgage
Purchase Details
Closed on
Jun 17, 2004
Sold by
Dufault Cecelia H and Dufault Paul L
Bought by
Renauld Rachael
Create a Home Valuation Report for This Property
The Home Valuation Report is an in-depth analysis detailing your home's value as well as a comparison with similar homes in the area
Home Values in the Area
Average Home Value in this Area
Purchase History
| Date | Buyer | Sale Price | Title Company |
|---|---|---|---|
| Duquette Michael A | -- | None Available | |
| Duquette Michael A | -- | None Available | |
| Duquette Sherri L | $150,000 | -- | |
| Renauld Rachael | $214,900 | -- | |
| Duquette Sherri L | $150,000 | -- | |
| Renauld Rachael | $214,900 | -- |
Source: Public Records
Mortgage History
| Date | Status | Borrower | Loan Amount |
|---|---|---|---|
| Open | Duquette Michael A | $30,000 | |
| Closed | Duquette Michael A | $30,000 | |
| Previous Owner | Duquette Sherri L | $148,006 | |
| Previous Owner | Renauld Rachael | $92,000 |
Source: Public Records
Tax History
| Year | Tax Paid | Tax Assessment Tax Assessment Total Assessment is a certain percentage of the fair market value that is determined by local assessors to be the total taxable value of land and additions on the property. | Land | Improvement |
|---|---|---|---|---|
| 2025 | $33 | $281,500 | $44,800 | $236,700 |
| 2024 | $2,993 | $261,600 | $44,800 | $216,800 |
| 2023 | $2,797 | $231,900 | $44,800 | $187,100 |
| 2022 | $2,762 | $209,900 | $40,800 | $169,100 |
| 2021 | $2,676 | $190,600 | $40,800 | $149,800 |
| 2020 | $2,537 | $179,700 | $40,800 | $138,900 |
| 2019 | $2,362 | $170,400 | $35,200 | $135,200 |
| 2018 | $2,059 | $153,400 | $42,900 | $110,500 |
| 2017 | $2,027 | $145,000 | $40,800 | $104,200 |
| 2016 | $1,966 | $137,600 | $40,800 | $96,800 |
| 2015 | $1,918 | $140,300 | $46,000 | $94,300 |
| 2014 | $1,845 | $140,300 | $46,000 | $94,300 |
Source: Public Records
Map
Nearby Homes
Your Personal Tour Guide
Ask me questions while you tour the home.