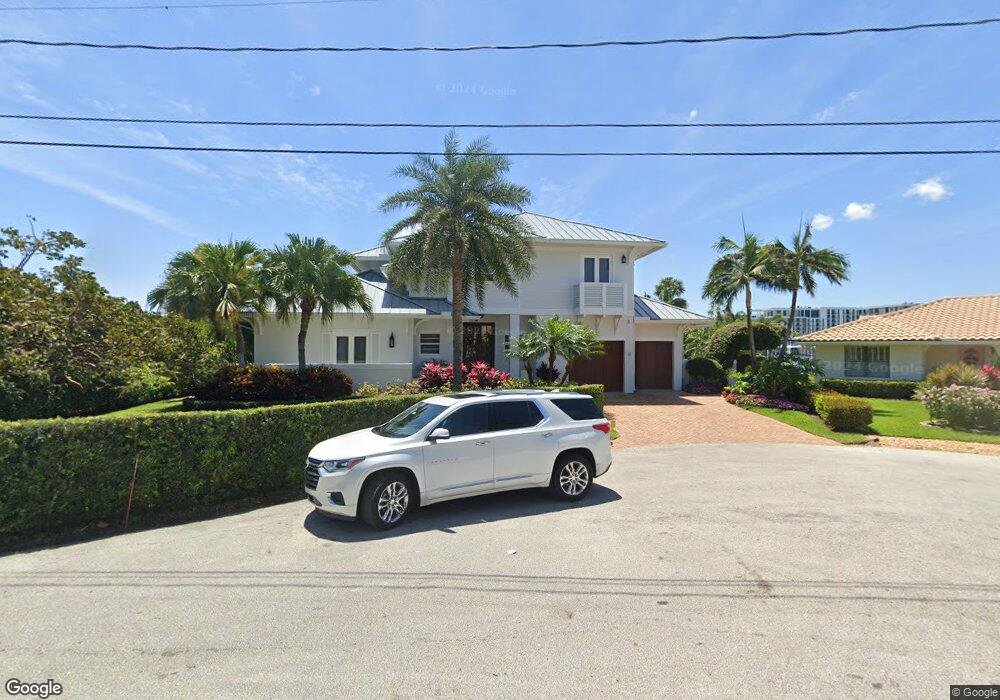
33 Hibiscus Way Boynton Beach, FL 33435
Estimated Value: $3,635,000 - $4,857,000
4
Beds
4
Baths
3,331
Sq Ft
$1,271/Sq Ft
Est. Value
About This Home
This home is located at 33 Hibiscus Way, Boynton Beach, FL 33435 and is currently estimated at $4,233,830, approximately $1,271 per square foot. 33 Hibiscus Way is a home located in Palm Beach County with nearby schools including Forest Park Elementary School, Boynton Beach Community High School, and Congress Community Middle School.
Ownership History
Date
Name
Owned For
Owner Type
Purchase Details
Closed on
Nov 27, 2018
Sold by
Meli Frank J
Bought by
Meli Frank and The Frank Meli Hibiscus Qualified Person
Current Estimated Value
Purchase Details
Closed on
Aug 18, 2015
Sold by
Dellechiaie Joseph and Dellechiaie Josephine
Bought by
Meli Frank J
Home Financials for this Owner
Home Financials are based on the most recent Mortgage that was taken out on this home.
Original Mortgage
$700,000
Outstanding Balance
$552,967
Interest Rate
4.16%
Mortgage Type
Seller Take Back
Estimated Equity
$3,680,863
Purchase Details
Closed on
Sep 14, 2007
Sold by
Dellechiaie Joseph and Dellechiaie Josephine
Bought by
Dellechiaie Joseph
Purchase Details
Closed on
Jul 24, 2003
Sold by
Dellechiaie Joseph and Dellechiaie Josephine
Bought by
Dellechiaie Joseph
Create a Home Valuation Report for This Property
The Home Valuation Report is an in-depth analysis detailing your home's value as well as a comparison with similar homes in the area
Home Values in the Area
Average Home Value in this Area
Purchase History
| Date | Buyer | Sale Price | Title Company |
|---|---|---|---|
| Meli Frank | -- | Attorney | |
| Meli Frank | -- | Attorney | |
| Meli Frank J | -- | Attorney | |
| Meli Frank J | $1,200,000 | Attorney | |
| Dellechiaie Joseph | -- | Attorney | |
| Dellechiaie Joseph | -- | Attorney | |
| Dellechiaie Joseph | -- | -- | |
| Dellechiaie Joseph | -- | -- |
Source: Public Records
Mortgage History
| Date | Status | Borrower | Loan Amount |
|---|---|---|---|
| Open | Meli Frank J | $700,000 |
Source: Public Records
Tax History Compared to Growth
Tax History
| Year | Tax Paid | Tax Assessment Tax Assessment Total Assessment is a certain percentage of the fair market value that is determined by local assessors to be the total taxable value of land and additions on the property. | Land | Improvement |
|---|---|---|---|---|
| 2024 | $48,057 | $2,129,977 | -- | -- |
| 2023 | $47,279 | $1,936,343 | $0 | $0 |
| 2022 | $39,198 | $1,760,312 | $0 | $0 |
| 2021 | $33,117 | $1,873,215 | $950,000 | $923,215 |
| 2020 | $28,441 | $1,454,804 | $765,000 | $689,804 |
| 2019 | $29,382 | $1,471,660 | $747,000 | $724,660 |
| 2018 | $28,309 | $1,472,818 | $874,474 | $598,344 |
| 2017 | $27,892 | $1,436,867 | $832,832 | $604,035 |
| 2016 | $26,378 | $1,318,763 | $0 | $0 |
| 2015 | $40,287 | $1,958,281 | $0 | $0 |
| 2014 | $29,455 | $1,455,851 | $0 | $0 |
Source: Public Records
Map
Nearby Homes
- 10 Ridge Blvd Unit D
- 650 Snug Harbor Dr Unit G310
- 650 Snug Harbor Dr Unit G110
- 655 Castilla Ln
- 640 Snug Harbor Dr Unit F6
- 638 Snug Harbor Dr Unit E7
- 5540 Osprey Dr
- 5 Osprey Ct
- 17 Adams Rd
- 632 Snug Harbor Dr Unit D3
- 630 Snug Harbor Dr Unit C4
- 18 Adams Rd
- 5550 N Ocean Blvd Unit 114
- 5550 N Ocean Blvd Unit 103
- 624 Snug Harbor Dr Unit B8
- 5550 N Ocean 107 Blvd Unit 107
- 5841 N Ocean Blvd Unit F2
- 5540 N Ocean Blvd Unit 212
- 5700 Old Ocean Blvd Unit R
- 5505 N Ocean Blvd