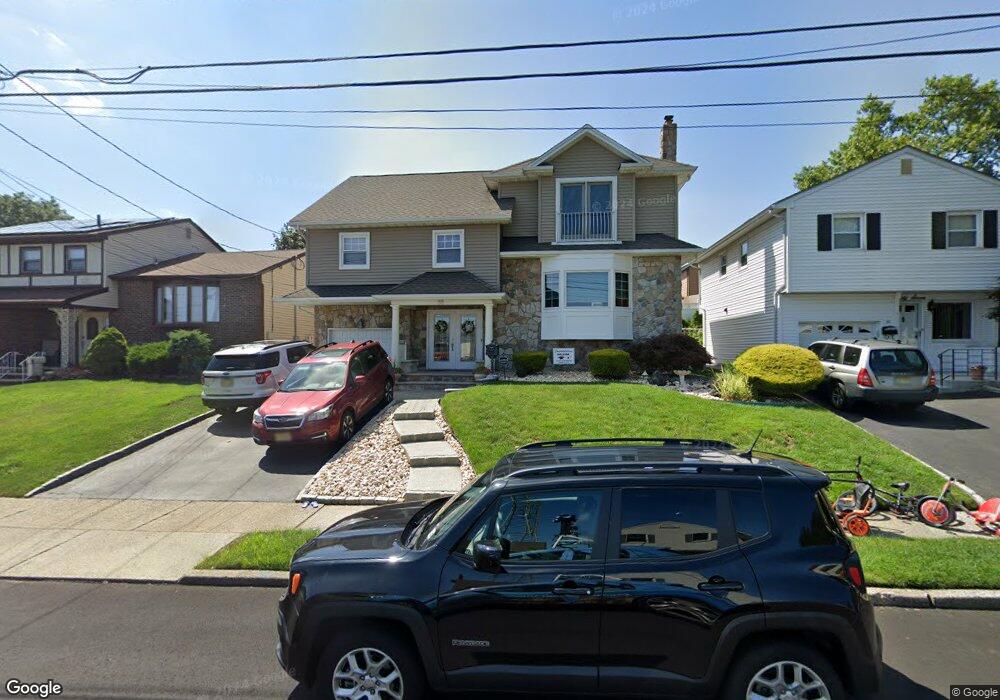
33 Hickory Rd Nutley, NJ 07110
Estimated Value: $706,000 - $785,000
Studio
--
Bath
1,960
Sq Ft
$375/Sq Ft
Est. Value
About This Home
This home is located at 33 Hickory Rd, Nutley, NJ 07110 and is currently estimated at $734,081, approximately $374 per square foot. 33 Hickory Rd is a home located in Essex County with nearby schools including Nutley High School and St Thomas The Apostle School.
Ownership History
Date
Name
Owned For
Owner Type
Purchase Details
Closed on
Dec 28, 2012
Sold by
Ugliarolo Joseph and Ugliarolo Anna
Bought by
Ugliarolo Joseph M and Ugliarolo Anna M
Current Estimated Value
Home Financials for this Owner
Home Financials are based on the most recent Mortgage that was taken out on this home.
Original Mortgage
$418,815
Outstanding Balance
$291,339
Interest Rate
3.38%
Mortgage Type
VA
Estimated Equity
$442,742
Purchase Details
Closed on
May 28, 2003
Sold by
Bihansky Roman
Bought by
Ugliarolo Joseph and Ugliarolo Anna
Create a Home Valuation Report for This Property
The Home Valuation Report is an in-depth analysis detailing your home's value as well as a comparison with similar homes in the area
Home Values in the Area
Average Home Value in this Area
Purchase History
| Date | Buyer | Sale Price | Title Company |
|---|---|---|---|
| Ugliarolo Joseph M | -- | None Available | |
| Ugliarolo Joseph | $375,000 | -- |
Source: Public Records
Mortgage History
| Date | Status | Borrower | Loan Amount |
|---|---|---|---|
| Open | Ugliarolo Joseph M | $418,815 |
Source: Public Records
Tax History
| Year | Tax Paid | Tax Assessment Tax Assessment Total Assessment is a certain percentage of the fair market value that is determined by local assessors to be the total taxable value of land and additions on the property. | Land | Improvement |
|---|---|---|---|---|
| 2025 | $14,814 | $584,800 | $235,000 | $349,800 |
| 2024 | $14,814 | $584,800 | $235,000 | $349,800 |
| 2022 | $13,761 | $362,600 | $145,000 | $217,600 |
| 2021 | $13,688 | $362,600 | $145,000 | $217,600 |
| 2020 | $13,101 | $362,600 | $145,000 | $217,600 |
| 2019 | $12,833 | $362,600 | $145,000 | $217,600 |
| 2018 | $12,481 | $362,600 | $145,000 | $217,600 |
| 2017 | $12,343 | $362,600 | $145,000 | $217,600 |
| 2016 | $11,970 | $362,600 | $145,000 | $217,600 |
| 2015 | $11,774 | $362,600 | $145,000 | $217,600 |
| 2014 | $11,622 | $362,600 | $145,000 | $217,600 |
Source: Public Records
Map
Nearby Homes
- 7 Faber Place
- 93 Bromley Place
- 387 Broughton Ave
- 383-387 Broughton Ave
- 171 Sadler Rd
- 209 Van Winkle Ave
- 70 Kierstead Ave
- 9 Pierson St
- 90 Dewey St
- 476 Harrison St
- 71 Spring St
- 33 Daka Ct
- 479 Centre St
- 50 Beech St
- 18 Farmingdale Ave
- 30 Andover Place
- 68 Ketner St
- 288 Harrison St
- 18 Ketner St
- 149 Crestwood Ave
Your Personal Tour Guide
Ask me questions while you tour the home.