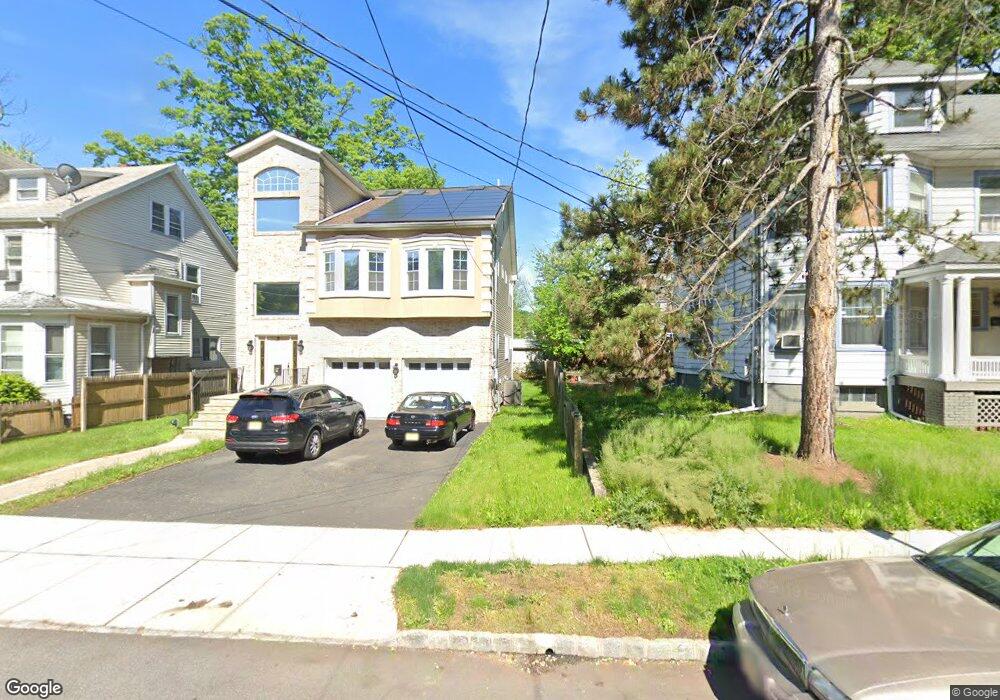
33 High St Orange, NJ 07050
Estimated Value: $263,083 - $311,000
Studio
--
Bath
992
Sq Ft
$286/Sq Ft
Est. Value
About This Home
This home is located at 33 High St, Orange, NJ 07050 and is currently estimated at $284,028, approximately $286 per square foot. 33 High St is a home located in Essex County.
Ownership History
Date
Name
Owned For
Owner Type
Purchase Details
Closed on
Mar 11, 2022
Sold by
Federal National Mortgage Assn
Bought by
Franklin Brothers Real Estate
Current Estimated Value
Home Financials for this Owner
Home Financials are based on the most recent Mortgage that was taken out on this home.
Original Mortgage
$133,000
Outstanding Balance
$123,489
Interest Rate
3.85%
Mortgage Type
New Conventional
Estimated Equity
$160,539
Purchase Details
Closed on
Jan 7, 2020
Sold by
Morrow Victoria J and Bakersville Malik S
Bought by
Federal National Mortgage Association
Purchase Details
Closed on
Jul 26, 2002
Sold by
Blmn Llc
Bought by
Baskerville Sandra
Home Financials for this Owner
Home Financials are based on the most recent Mortgage that was taken out on this home.
Original Mortgage
$106,700
Interest Rate
6.64%
Create a Home Valuation Report for This Property
The Home Valuation Report is an in-depth analysis detailing your home's value as well as a comparison with similar homes in the area
Home Values in the Area
Average Home Value in this Area
Purchase History
| Date | Buyer | Sale Price | Title Company |
|---|---|---|---|
| Franklin Brothers Real Estate | $133,900 | Boston National Title Agency | |
| Federal National Mortgage Association | -- | None Available | |
| Baskerville Sandra | $110,000 | -- |
Source: Public Records
Mortgage History
| Date | Status | Borrower | Loan Amount |
|---|---|---|---|
| Open | Franklin Brothers Real Estate | $133,000 | |
| Previous Owner | Baskerville Sandra | $106,700 |
Source: Public Records
Tax History
| Year | Tax Paid | Tax Assessment Tax Assessment Total Assessment is a certain percentage of the fair market value that is determined by local assessors to be the total taxable value of land and additions on the property. | Land | Improvement |
|---|---|---|---|---|
| 2025 | $5,497 | $147,500 | $47,500 | $100,000 |
| 2024 | $5,497 | $147,500 | $47,500 | $100,000 |
| 2022 | $5,112 | $147,500 | $47,500 | $100,000 |
| 2021 | $5,572 | $96,400 | $45,000 | $51,400 |
| 2020 | $5,405 | $96,400 | $45,000 | $51,400 |
| 2019 | $5,124 | $96,400 | $45,000 | $51,400 |
| 2018 | $5,042 | $96,400 | $45,000 | $51,400 |
| 2017 | $4,695 | $96,400 | $45,000 | $51,400 |
| 2016 | $4,606 | $96,400 | $45,000 | $51,400 |
| 2015 | $4,485 | $96,400 | $45,000 | $51,400 |
| 2014 | $4,289 | $96,400 | $45,000 | $51,400 |
Source: Public Records
Map
Nearby Homes
- 70 N Essex Ave
- 52 Lincoln Ave Unit 303
- 52 Lincoln Ave Unit 302
- 162 Summer St
- 350 Park Ave
- 146 Spring St
- 148 N Essex Ave
- 309 Park Ave
- 29 White St
- 328 Hawthorne St
- 240 Watchung Ave
- 237 Cleveland St
- 414 Mechanic St
- 261 Park Ave
- 107 Main St
- 271 Mount Vernon Ave
- 9 Wheeler St
- 205 Snyder St
- 527 Cary St
- 228 Duane St
Your Personal Tour Guide
Ask me questions while you tour the home.