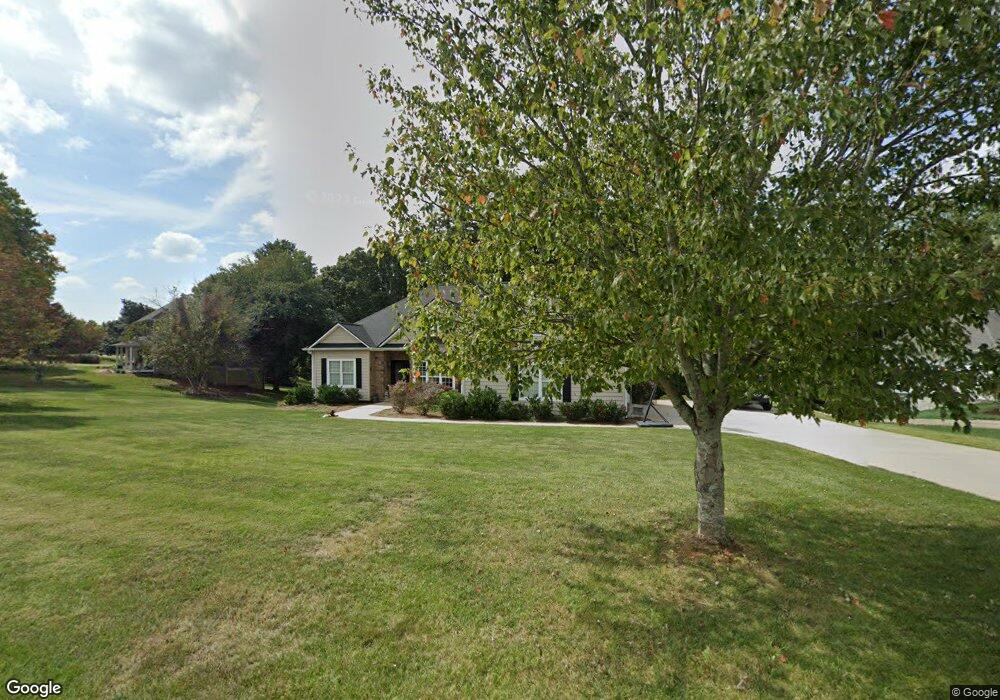
33 Highland Rd N Dahlonega, GA 30533
Estimated Value: $543,339 - $680,000
--
Bed
4
Baths
3,682
Sq Ft
$170/Sq Ft
Est. Value
About This Home
This home is located at 33 Highland Rd N, Dahlonega, GA 30533 and is currently estimated at $626,585, approximately $170 per square foot. 33 Highland Rd N is a home located in Lumpkin County with nearby schools including Clay County Middle School and Lumpkin County High School.
Ownership History
Date
Name
Owned For
Owner Type
Purchase Details
Closed on
May 3, 2006
Sold by
Not Provided
Bought by
Faulkner Christopher and Faulkner Dahpney
Current Estimated Value
Home Financials for this Owner
Home Financials are based on the most recent Mortgage that was taken out on this home.
Original Mortgage
$230,400
Outstanding Balance
$139,293
Interest Rate
6.33%
Mortgage Type
New Conventional
Estimated Equity
$487,292
Purchase Details
Closed on
Mar 25, 1998
Sold by
Larson Cullen C
Bought by
Lacount William Davi
Purchase Details
Closed on
Feb 28, 1992
Sold by
Fieldale Farms Corpi
Bought by
Larson Cullen C
Purchase Details
Closed on
Jun 10, 1991
Sold by
Everson Carl
Bought by
Fieldale Farms Corpi
Purchase Details
Closed on
Oct 13, 1989
Sold by
Dover Vinson Et
Bought by
Everson Carl
Purchase Details
Closed on
Mar 1, 1986
Bought by
Dover Vinson Et
Create a Home Valuation Report for This Property
The Home Valuation Report is an in-depth analysis detailing your home's value as well as a comparison with similar homes in the area
Home Values in the Area
Average Home Value in this Area
Purchase History
| Date | Buyer | Sale Price | Title Company |
|---|---|---|---|
| Faulkner Christopher | $55,000 | -- | |
| Lacount William Davi | $194,000 | -- | |
| Larson Cullen C | $11,100 | -- | |
| Fieldale Farms Corpi | $16,500 | -- | |
| Everson Carl | $16,500 | -- | |
| Dover Vinson Et | -- | -- |
Source: Public Records
Mortgage History
| Date | Status | Borrower | Loan Amount |
|---|---|---|---|
| Open | Faulkner Christopher | $230,400 |
Source: Public Records
Tax History Compared to Growth
Tax History
| Year | Tax Paid | Tax Assessment Tax Assessment Total Assessment is a certain percentage of the fair market value that is determined by local assessors to be the total taxable value of land and additions on the property. | Land | Improvement |
|---|---|---|---|---|
| 2024 | $5,001 | $182,249 | $14,000 | $168,249 |
| 2023 | $4,411 | $172,755 | $14,000 | $158,755 |
| 2022 | $4,939 | $163,392 | $14,000 | $149,392 |
| 2021 | $4,568 | $141,690 | $14,000 | $127,690 |
| 2020 | $4,648 | $138,790 | $14,000 | $124,790 |
| 2019 | $4,671 | $138,790 | $14,000 | $124,790 |
| 2018 | $4,422 | $123,145 | $14,000 | $109,145 |
| 2017 | $4,317 | $118,278 | $14,000 | $104,278 |
| 2016 | $4,138 | $111,027 | $14,000 | $97,027 |
| 2015 | $3,573 | $111,027 | $14,000 | $97,027 |
| 2014 | $3,573 | $112,082 | $14,000 | $98,082 |
| 2013 | -- | $113,136 | $14,000 | $99,136 |
Source: Public Records
Map
Nearby Homes
- 65 Golden Autumn Dr
- 149 Highland Rd S
- 77 Old River Rd
- 238 Grand View St
- 159 Misty Way
- LOT 6 Sky Country Rd
- 2589 Morrison Moore Pkwy E
- 181 Gilreath Way
- 00 Cavender Creek Rd
- 122 Tritt Rd
- 97 Beaumont Dr
- 0 Timberlane Dr Unit 10483799
- 0 Timberlane Dr Unit 7479971
- 0 Camp Wahsega Rd Unit 7600956
- 0 Camp Wahsega Rd Unit 10547292
- 4039 Highway 19 N
- 85 Summit Canyon Rd Unit H102
- 94 Mountain View Dr
- 502 Wimpy Mill Rd
- 00 LOT C Cavender Creek Rd
- 00 River Highlands Rd
- 38 Highland Rd S
- 0 The Highlands Unit 5962186
- 0 The Highlands Unit C 8322069
- 0 The Highlands Unit Trct B 8289599
- 0 The Highlands Unit 6553740
- 0 The Highlands Unit 8584400
- 35 Highland Rd N
- 36 Highland Rd N
- 12 Highland Rd N
- 29 Highland Rd S
- 62 Highland Rd S
- 48 Highland Rd N
- 82 Highland Rd S Unit 114
- 82 Highland Rd S
- 45 Highland Rd S
- 53 Windsor Way
- 336 Cloudland Rd N
- 11 Golden Autumn Dr
- 26 Windsor Way