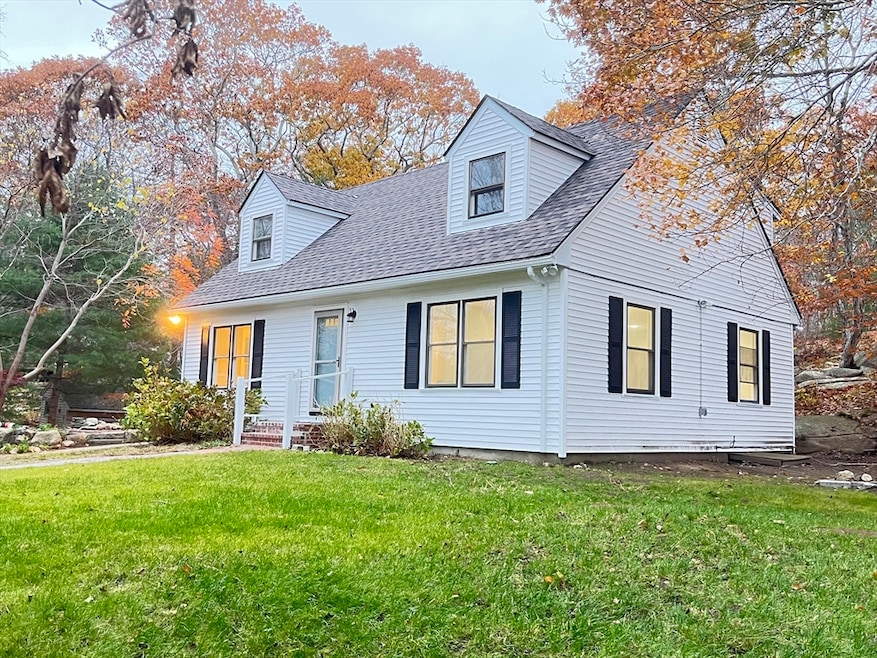
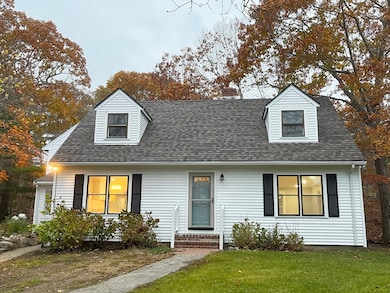
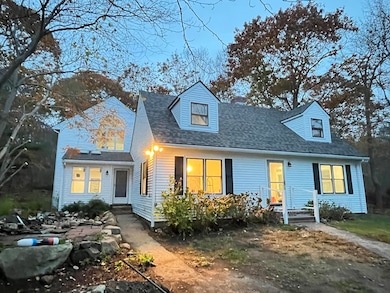

33 Highview Rd Rockport, MA 01966
Estimated payment $6,062/month
Highlights
- Beach Front
- Property is near public transit
- No HOA
- Cape Cod Architecture
- 4 Fireplaces
- Cooling System Mounted In Outer Wall Opening
About This Home
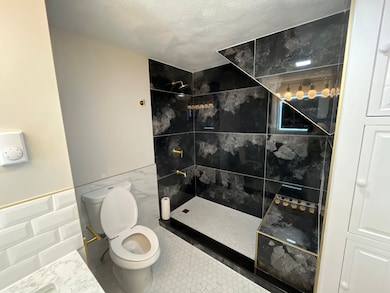
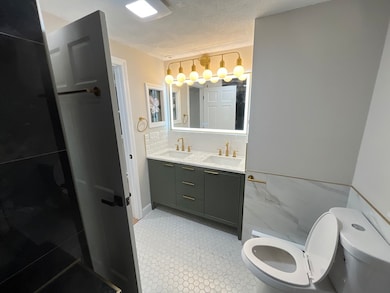
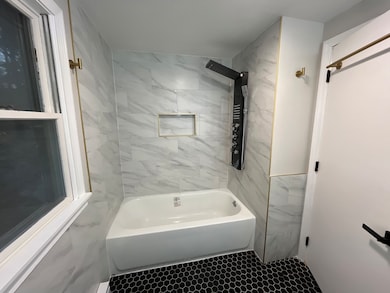
Fully Renovated 3BD/3BA in Rockport – Walk to the BeachWelcome to 33 Highview Road—a fully updated coastal home featuring a new roof, new siding, new hardwood floors, and a modern kitchen with quartz counters and stainless appliances. 4 fire places! The bright, open layout includes three refreshed full bathrooms and turnkey finishes throughout.Located in a desirable neighborhood just a short walk to the beach, this property delivers everyday convenience with true coastal living.Newly installed septic-Title V has passed, and renovations are complete. Move-in ready and low-maintenance—perfect for buyers seeking clean design and strong long-term value. Street taken over by Town, brand new street and sidewalk in progress.
Home Details
Home Type
- Single Family
Est. Annual Taxes
- $7,463
Year Built
- Built in 1982
Lot Details
- 19,515 Sq Ft Lot
- Beach Front
- Property is zoned RA
Home Design
- Cape Cod Architecture
- Shingle Roof
- Concrete Perimeter Foundation
Interior Spaces
- 2,624 Sq Ft Home
- 4 Fireplaces
Bedrooms and Bathrooms
- 3 Bedrooms
Parking
- 4 Car Parking Spaces
- Driveway
- Paved Parking
- 4 Open Parking Spaces
- Off-Street Parking
Location
- Property is near public transit
Utilities
- Cooling System Mounted In Outer Wall Opening
- Wood Insert Heater
- Heating System Uses Propane
- Electric Baseboard Heater
- Electric Water Heater
- Private Sewer
Community Details
- No Home Owners Association
- Near Conservation Area
Listing and Financial Details
- Assessor Parcel Number M:25 B:97,2120244
Map
Home Values in the Area
Average Home Value in this Area
Tax History
We collect this data history from publicly available records. To have your information removed, we recommend requesting removal directly through your county’s website.
| Year | Tax Paid | Tax Assessment Tax Assessment Total Assessment is a certain percentage of the fair market value that is determined by local assessors to be the total taxable value of land and additions on the property. | Land | Improvement |
|---|---|---|---|---|
| 2025 | $7,463 | $851,900 | $334,400 | $517,500 |
| 2024 | $7,043 | $836,500 | $319,000 | $517,500 |
| 2023 | $7,012 | $743,600 | $295,000 | $448,600 |
| 2022 | $6,971 | $709,900 | $296,500 | $413,400 |
| 2021 | $6,633 | $681,000 | $282,500 | $398,500 |
| 2020 | $6,328 | $626,500 | $237,900 | $388,600 |
| 2019 | $5,940 | $602,400 | $234,600 | $367,800 |
| 2018 | $5,894 | $583,000 | $224,400 | $358,600 |
| 2017 | $5,796 | $513,800 | $203,500 | $310,300 |
| 2016 | $5,893 | $523,800 | $197,800 | $326,000 |
| 2015 | $5,647 | $513,400 | $197,800 | $315,600 |
| 2014 | $5,406 | $479,700 | $179,800 | $299,900 |
Property History
We collect this data history from publicly available records. To have your information removed, we recommend requesting removal directly through your county’s website.
| Date | Event | Price | List to Sale | Price per Sq Ft |
|---|---|---|---|---|
| 05/28/2026 05/28/26 | Price Changed | $1,025,000 | -2.3% | $391 / Sq Ft |
| 05/15/2026 05/15/26 | Price Changed | $1,049,000 | -2.4% | $400 / Sq Ft |
| 05/07/2026 05/07/26 | Price Changed | $1,075,000 | -1.3% | $410 / Sq Ft |
| 04/24/2026 04/24/26 | Price Changed | $1,089,000 | -0.9% | $415 / Sq Ft |
| 11/14/2025 11/14/25 | For Sale | $1,099,000 | -- | $419 / Sq Ft |
Purchase History
We collect this data history from publicly available records. To have your information removed, we recommend requesting removal directly through your county’s website.
| Date | Type | Sale Price | Title Company |
|---|---|---|---|
| Quit Claim Deed | -- | None Available | |
| Quit Claim Deed | -- | None Available | |
| Quit Claim Deed | -- | None Available | |
| Foreclosure Deed | $690,000 | None Available | |
| Foreclosure Deed | $690,000 | None Available | |
| Foreclosure Deed | $690,000 | None Available |
Mortgage History
We collect this data history from publicly available records. To have your information removed, we recommend requesting removal directly through your county’s website.
| Date | Status | Loan Amount | Loan Type |
|---|---|---|---|
| Open | $517,500 | New Conventional | |
| Closed | $517,500 | Purchase Money Mortgage |
Source: MLS Property Information Network (MLS PIN)
MLS Number: 73454882
APN: ROCK-000025-000000-000097
Disclaimer: Certain information contained herein is derived from information provided by parties other than Homes.com. All information provided is deemed reliable, but is not guaranteed to be accurate and should be independently verified.
![]() The property listing data and information, or the Images, set forth herein were provided to MLS Property Information Network, Inc. from third party sources, including sellers, lessors and public records, and were compiled by MLS Property Information Network, Inc. The property listing data and information, and the Images, are for the personal, non-commercial use of consumers having a good faith interest in purchasing or leasing listed properties of the type displayed to them and may not be used for any purpose other than to identify prospective properties which such consumers may have a good faith interest in purchasing or leasing. MLS Property Information Network, Inc. and its subscribers disclaim any and all representations and warranties as to the accuracy of the property listing data and information, or as to the accuracy of any of the Images, set forth herein.
The property listing data and information, or the Images, set forth herein were provided to MLS Property Information Network, Inc. from third party sources, including sellers, lessors and public records, and were compiled by MLS Property Information Network, Inc. The property listing data and information, and the Images, are for the personal, non-commercial use of consumers having a good faith interest in purchasing or leasing listed properties of the type displayed to them and may not be used for any purpose other than to identify prospective properties which such consumers may have a good faith interest in purchasing or leasing. MLS Property Information Network, Inc. and its subscribers disclaim any and all representations and warranties as to the accuracy of the property listing data and information, or as to the accuracy of any of the Images, set forth herein.
- 9 Oxford Rd
- 18r Starknaught Heights Unit A
- 68 Eden Rd
- 176 Main St Unit B
- 176 Main St Unit A
- 27 Hodgkins Rd
- 25 Salt Island Rd
- 48 Eden Rd
- 1B Greystone Ln Unit 1B
- 32 Witham St Unit B
- 4 Toomey Ln
- 64 High St
- 38 & 38R High St
- 6 Parker St
- 34 Mount Pleasant St
- 24 High St Unit 1
- 8 Marbee Rd
- 15 High St Unit D
- 1 High St
- 2 Mount Pleasant St Unit 3
- 11 Rockport Rd
- 16 Warwick Rd
- 196 Main St Unit A
- 0 Dodds Ln Unit 2
- 5 High Street Ct
- 32 Mount Pleasant St Unit 2
- 34 High St Unit C
- 20 Smith Rd Unit SUMMER
- 8 Beach St
- 6 Middle Rd Unit SI ID1045449P
- 37 Marmion Way
- 126 Eastern Ave Unit A
- 19 Atlantic Rd Unit 16
- 19 Atlantic Rd Unit 13
- 82 Bass Ave
- 39 Decatur St Unit SUMMER
- 68 Perkins St
- 23 Mt Vernon St Unit 2
- 23 Mt Vernon St Unit 5
- 5 Pirate's Ln Unit 1

Ask me questions while you tour the home.