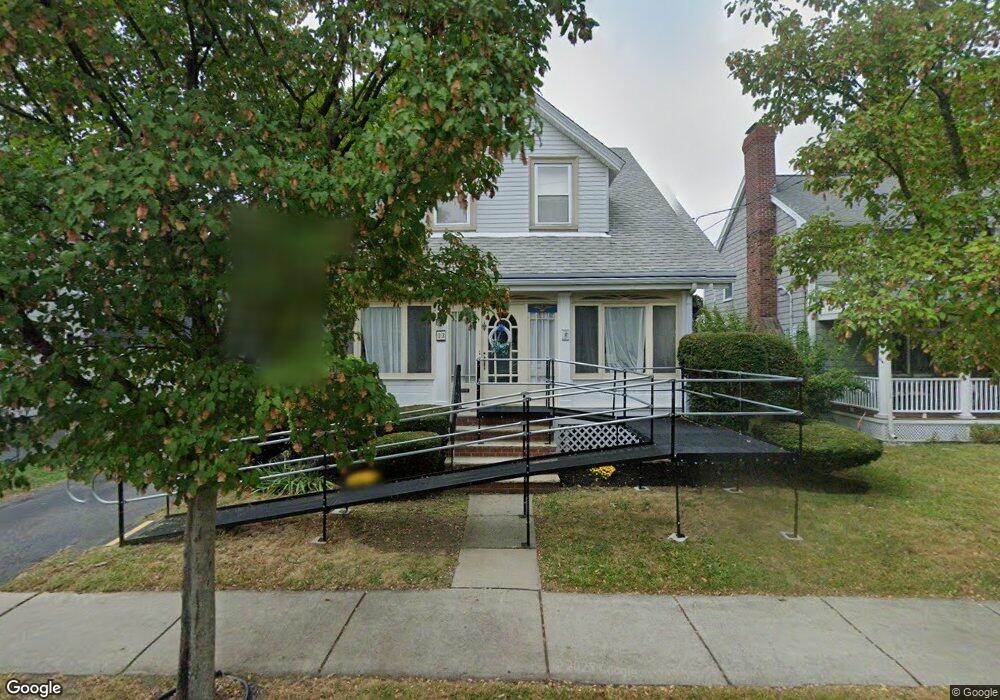
33 Hobomack Rd Quincy, MA 02169
Merrymount NeighborhoodEstimated Value: $728,000 - $839,000
4
Beds
2
Baths
1,766
Sq Ft
$447/Sq Ft
Est. Value
About This Home
This home is located at 33 Hobomack Rd, Quincy, MA 02169 and is currently estimated at $788,847, approximately $446 per square foot. 33 Hobomack Rd is a home located in Norfolk County with nearby schools including Merrymount Elementary School, Broad Meadows Middle School, and Quincy High School.
Ownership History
Date
Name
Owned For
Owner Type
Purchase Details
Closed on
Dec 4, 2019
Sold by
Brown David W
Bought by
Carson Taylor and Carson Paul W
Current Estimated Value
Home Financials for this Owner
Home Financials are based on the most recent Mortgage that was taken out on this home.
Original Mortgage
$300,000
Outstanding Balance
$264,706
Interest Rate
3.75%
Mortgage Type
New Conventional
Estimated Equity
$524,141
Purchase Details
Closed on
Jan 28, 1981
Bought by
Brown David W
Create a Home Valuation Report for This Property
The Home Valuation Report is an in-depth analysis detailing your home's value as well as a comparison with similar homes in the area
Home Values in the Area
Average Home Value in this Area
Purchase History
| Date | Buyer | Sale Price | Title Company |
|---|---|---|---|
| Carson Taylor | $450,000 | None Available | |
| Brown David W | -- | -- |
Source: Public Records
Mortgage History
| Date | Status | Borrower | Loan Amount |
|---|---|---|---|
| Open | Carson Taylor | $300,000 | |
| Previous Owner | Brown David W | $61,000 | |
| Previous Owner | Brown David W | $75,000 |
Source: Public Records
Tax History
| Year | Tax Paid | Tax Assessment Tax Assessment Total Assessment is a certain percentage of the fair market value that is determined by local assessors to be the total taxable value of land and additions on the property. | Land | Improvement |
|---|---|---|---|---|
| 2025 | $7,539 | $653,900 | $346,700 | $307,200 |
| 2024 | $7,224 | $641,000 | $336,500 | $304,500 |
| 2023 | $6,425 | $577,300 | $292,700 | $284,600 |
| 2022 | $6,264 | $522,900 | $243,900 | $279,000 |
| 2021 | $6,223 | $512,600 | $243,900 | $268,700 |
| 2020 | $6,234 | $501,500 | $234,500 | $267,000 |
| 2019 | $5,703 | $454,400 | $219,100 | $235,300 |
| 2018 | $5,445 | $408,200 | $181,900 | $226,300 |
| 2017 | $5,759 | $406,400 | $190,600 | $215,800 |
| 2016 | $5,718 | $398,200 | $187,100 | $211,100 |
| 2015 | $5,297 | $362,800 | $176,500 | $186,300 |
| 2014 | $4,983 | $335,300 | $171,200 | $164,100 |
Source: Public Records
Map
Nearby Homes
- 1 Homer Rd
- 59 Terne Rd
- 105 Sea St Unit 105
- 105 Sea St Unit 102
- 11 Riverside Ave
- 270 Southern Artery
- 266 Furnace Brook Pkwy Unit 2
- 82 Edison St Unit 82
- 74 Butler Rd
- 10 Edgemere Rd
- 66 Mcgrath Hwy Unit 403
- 66 Mcgrath Hwy Unit 409
- 66 Mcgrath Hwy Unit 301
- 66 Mcgrath Hwy Unit 204
- 59 Spear St Unit 301
- 20 Whitney Rd Unit 1
- 1022 Hancock St Unit 112
- 17-19 Lowe St
- 388 Washington St Unit 101
- 388 Washington St Unit 401
- 29 Hobomack Rd
- 46 Chickatabot Rd
- 25 Hobomack Rd
- 41 Hobomack Rd
- 44 Chickatabot Rd
- 50 Chickatabot Rd
- 42 Chickatabot Rd
- 36 Hobomack Rd
- 34 Hobomack Rd
- 52 Chickatabot Rd
- 30 Hobomack Rd
- 38 Hobomack Rd
- 45 Hobomack Rd
- 19 Hobomack Rd
- 40 Chickatabot Rd
- 26 Hobomack Rd
- 21 Hobomack Rd
- 42 Hobomack Rd
- 56 Chickatabot Rd
- 22 Hobomack Rd
Your Personal Tour Guide
Ask me questions while you tour the home.