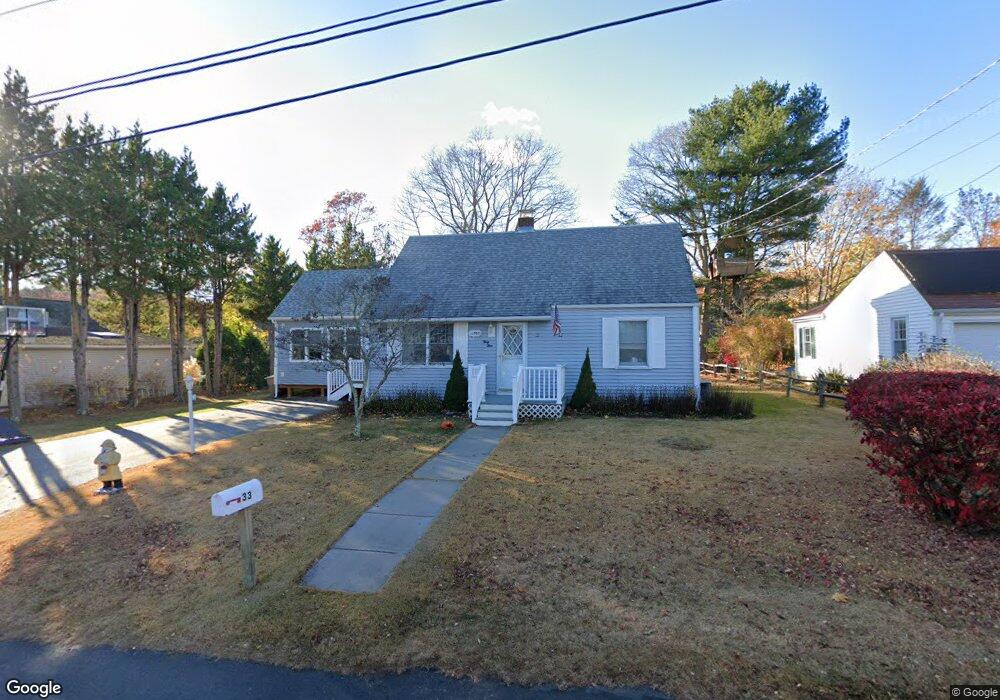
33 Huntley Ct Niantic, CT 06357
Estimated Value: $527,385 - $581,000
4
Beds
2
Baths
1,926
Sq Ft
$284/Sq Ft
Est. Value
About This Home
This home is located at 33 Huntley Ct, Niantic, CT 06357 and is currently estimated at $547,096, approximately $284 per square foot. 33 Huntley Ct is a home located in New London County with nearby schools including East Lyme Middle School, East Lyme High School, and Carelot Children's Center - East Lyme.
Ownership History
Date
Name
Owned For
Owner Type
Purchase Details
Closed on
Sep 22, 2023
Sold by
Yuhas William and Yuhas Melissa
Bought by
Smith Keith L and Smith Heather J
Current Estimated Value
Purchase Details
Closed on
Aug 9, 2016
Sold by
Goss Lois A Est and Goss
Bought by
Yuhas William and Yuhas Melissa
Home Financials for this Owner
Home Financials are based on the most recent Mortgage that was taken out on this home.
Original Mortgage
$200,000
Interest Rate
3.56%
Mortgage Type
New Conventional
Create a Home Valuation Report for This Property
The Home Valuation Report is an in-depth analysis detailing your home's value as well as a comparison with similar homes in the area
Home Values in the Area
Average Home Value in this Area
Purchase History
| Date | Buyer | Sale Price | Title Company |
|---|---|---|---|
| Smith Keith L | -- | None Available | |
| Smith Keith L | -- | None Available | |
| Yuhas William | $245,000 | -- | |
| Yuhas William | $245,000 | -- |
Source: Public Records
Mortgage History
| Date | Status | Borrower | Loan Amount |
|---|---|---|---|
| Previous Owner | Yuhas William | $200,000 |
Source: Public Records
Tax History Compared to Growth
Tax History
| Year | Tax Paid | Tax Assessment Tax Assessment Total Assessment is a certain percentage of the fair market value that is determined by local assessors to be the total taxable value of land and additions on the property. | Land | Improvement |
|---|---|---|---|---|
| 2025 | $5,919 | $211,330 | $87,150 | $124,180 |
| 2024 | $4,965 | $188,440 | $87,150 | $101,290 |
| 2023 | $4,690 | $188,510 | $87,220 | $101,290 |
| 2022 | $4,494 | $188,510 | $87,220 | $101,290 |
| 2021 | $4,333 | $151,970 | $82,880 | $69,090 |
| 2020 | $4,290 | $151,270 | $82,880 | $68,390 |
| 2019 | $4,264 | $151,270 | $82,880 | $68,390 |
| 2018 | $4,137 | $151,270 | $82,880 | $68,390 |
| 2017 | $3,957 | $151,270 | $82,880 | $68,390 |
| 2016 | $3,726 | $146,930 | $78,540 | $68,390 |
| 2015 | $3,631 | $146,930 | $78,540 | $68,390 |
| 2014 | $3,531 | $146,930 | $78,540 | $68,390 |
Source: Public Records
Map
Nearby Homes
- 127 Black Point Rd Unit 7
- 68-70 Black Point Rd
- 97 W Main St Unit 24
- 47 Village Crossing Unit 47
- 5 Faulkner Dr
- 46 Village Crossing Unit 46
- 48 Village Crossing Unit 48
- 43 Village Crossing Unit 43
- 18 Compass Ct
- 468 Main St Unit 111
- 468 Main St Unit 318
- 36 Attawan Rd
- 9 Columbus Ave
- 2 N Cobblers Ct
- 5 Attawan Ave
- 37 Stoneywood Dr
- 38 Hope St Unit 1307
- 48 Billow Rd
- 11 Sunset Ave
- 15 Griswold Rd