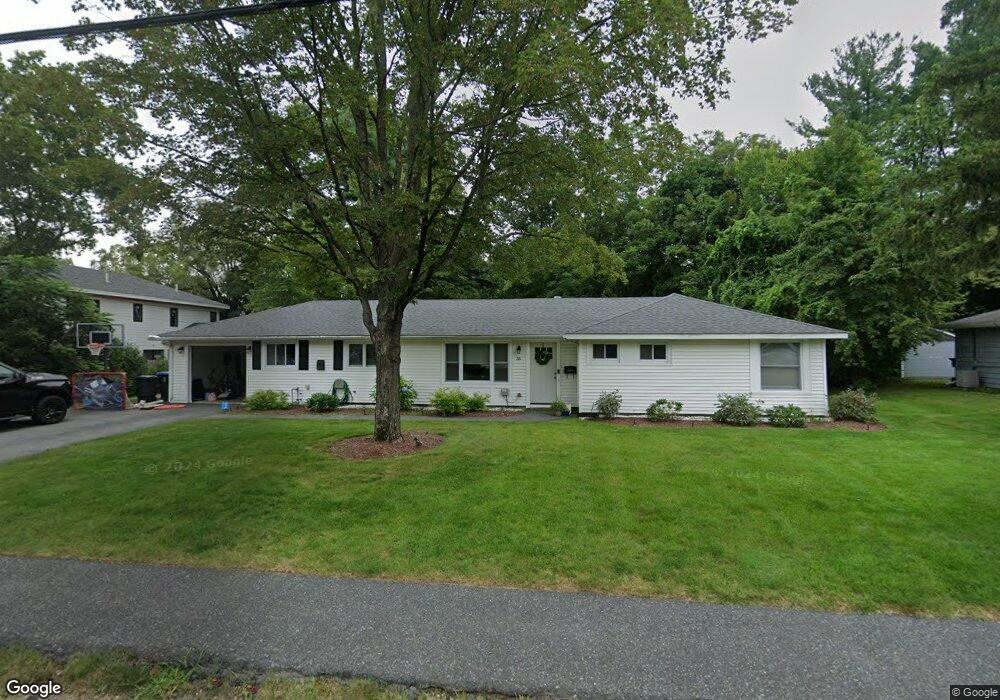
33 Irving Rd Natick, MA 01760
Estimated Value: $934,000 - $1,006,000
4
Beds
3
Baths
1,840
Sq Ft
$533/Sq Ft
Est. Value
About This Home
This home is located at 33 Irving Rd, Natick, MA 01760 and is currently estimated at $980,761, approximately $533 per square foot. 33 Irving Rd is a home located in Middlesex County with nearby schools including Natick High School, Bennett-Hemenway (Ben-Hem) Elementary School, and Wilson Middle School.
Ownership History
Date
Name
Owned For
Owner Type
Purchase Details
Closed on
Apr 29, 2016
Sold by
Jacobs Richard and Jacobs Brian J
Bought by
Rogal Crystal L and Rogal Alexander C
Current Estimated Value
Home Financials for this Owner
Home Financials are based on the most recent Mortgage that was taken out on this home.
Original Mortgage
$360,000
Outstanding Balance
$287,237
Interest Rate
3.73%
Mortgage Type
New Conventional
Estimated Equity
$693,524
Purchase Details
Closed on
Mar 2, 2007
Sold by
33 Irving Road Nt
Bought by
Jacobs Brian J and Jacobs Rachel A
Purchase Details
Closed on
Nov 21, 2005
Sold by
Gadman Broney and Eagerman Morris
Bought by
33 Irving Road Nt
Create a Home Valuation Report for This Property
The Home Valuation Report is an in-depth analysis detailing your home's value as well as a comparison with similar homes in the area
Home Values in the Area
Average Home Value in this Area
Purchase History
| Date | Buyer | Sale Price | Title Company |
|---|---|---|---|
| Rogal Crystal L | $350,000 | -- | |
| Jacobs Brian J | -- | -- | |
| 33 Irving Road Nt | $210,000 | -- |
Source: Public Records
Mortgage History
| Date | Status | Borrower | Loan Amount |
|---|---|---|---|
| Open | Rogal Crystal L | $360,000 |
Source: Public Records
Tax History
| Year | Tax Paid | Tax Assessment Tax Assessment Total Assessment is a certain percentage of the fair market value that is determined by local assessors to be the total taxable value of land and additions on the property. | Land | Improvement |
|---|---|---|---|---|
| 2025 | $9,976 | $834,100 | $461,300 | $372,800 |
| 2024 | $9,618 | $784,500 | $435,700 | $348,800 |
| 2023 | $9,232 | $730,400 | $409,000 | $321,400 |
| 2022 | $8,982 | $673,300 | $372,300 | $301,000 |
| 2021 | $8,630 | $634,100 | $351,900 | $282,200 |
| 2020 | $8,422 | $618,800 | $336,600 | $282,200 |
| 2019 | $7,865 | $618,800 | $336,600 | $282,200 |
| 2018 | $7,428 | $569,200 | $306,000 | $263,200 |
| 2017 | $5,249 | $389,100 | $272,500 | $116,600 |
| 2016 | $5,063 | $373,100 | $257,500 | $115,600 |
| 2015 | $5,022 | $363,400 | $257,500 | $105,900 |
Source: Public Records
Map
Nearby Homes
Your Personal Tour Guide
Ask me questions while you tour the home.