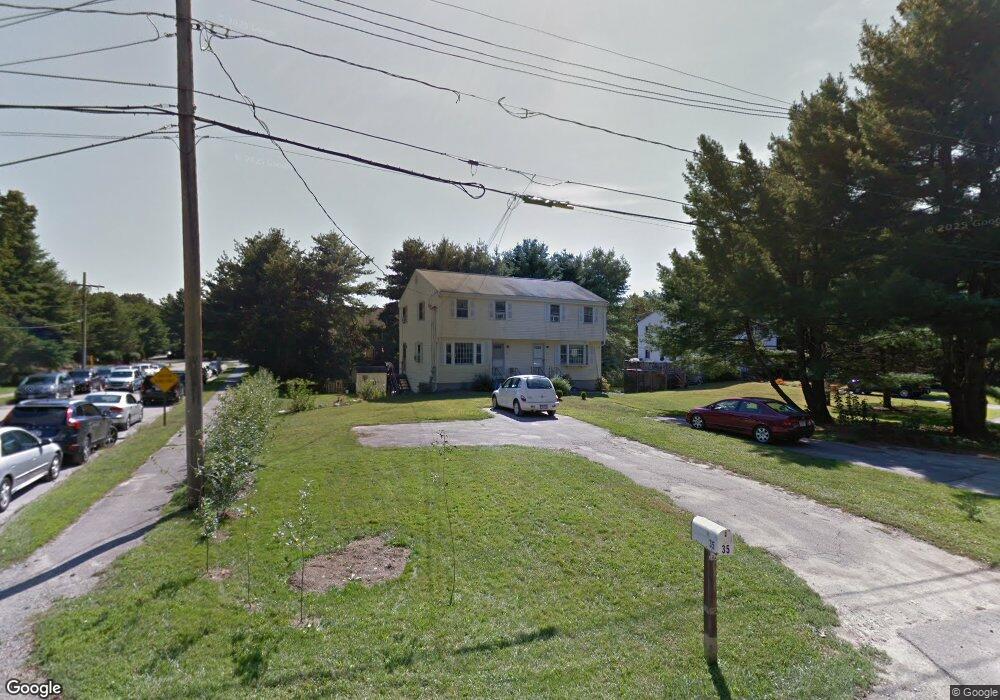
33 Island Rd Unit 35 Millis, MA 02054
Estimated Value: $627,716 - $859,000
5
Beds
3
Baths
2,236
Sq Ft
$328/Sq Ft
Est. Value
About This Home
This home is located at 33 Island Rd Unit 35, Millis, MA 02054 and is currently estimated at $732,429, approximately $327 per square foot. 33 Island Rd Unit 35 is a home located in Norfolk County with nearby schools including Clyde F Brown, Millis Middle School, and Millis High School.
Ownership History
Date
Name
Owned For
Owner Type
Purchase Details
Closed on
Jun 26, 2017
Sold by
Adams John H and Adams Dawn A
Bought by
Island Road 2017 Rt
Current Estimated Value
Purchase Details
Closed on
Oct 10, 2012
Sold by
Island Road Rt
Bought by
Adams John H and Adams Dawn A
Home Financials for this Owner
Home Financials are based on the most recent Mortgage that was taken out on this home.
Original Mortgage
$125,000
Interest Rate
4%
Mortgage Type
Adjustable Rate Mortgage/ARM
Purchase Details
Closed on
Oct 5, 2011
Sold by
Island Road Rt
Bought by
Adams John H and Adams Dawn A
Home Financials for this Owner
Home Financials are based on the most recent Mortgage that was taken out on this home.
Original Mortgage
$100,000
Interest Rate
4.2%
Purchase Details
Closed on
Jul 1, 1998
Sold by
Nadol Joseph B and Nadol Ruth Z
Bought by
Adams Tr Dawn A
Create a Home Valuation Report for This Property
The Home Valuation Report is an in-depth analysis detailing your home's value as well as a comparison with similar homes in the area
Home Values in the Area
Average Home Value in this Area
Purchase History
| Date | Buyer | Sale Price | Title Company |
|---|---|---|---|
| Island Road 2017 Rt | -- | -- | |
| Adams John H | -- | -- | |
| Adams John H | -- | -- | |
| Adams Tr Dawn A | $180,970 | -- |
Source: Public Records
Mortgage History
| Date | Status | Borrower | Loan Amount |
|---|---|---|---|
| Previous Owner | Adams John H | $125,000 | |
| Previous Owner | Adams John H | $100,000 |
Source: Public Records
Tax History Compared to Growth
Tax History
| Year | Tax Paid | Tax Assessment Tax Assessment Total Assessment is a certain percentage of the fair market value that is determined by local assessors to be the total taxable value of land and additions on the property. | Land | Improvement |
|---|---|---|---|---|
| 2025 | $8,682 | $529,400 | $239,500 | $289,900 |
| 2024 | $8,396 | $511,300 | $221,000 | $290,300 |
| 2023 | $8,068 | $461,300 | $176,200 | $285,100 |
| 2022 | $8,628 | $457,000 | $189,000 | $268,000 |
| 2021 | $6,963 | $354,900 | $163,400 | $191,500 |
| 2020 | $6,932 | $344,200 | $152,700 | $191,500 |
| 2019 | $6,205 | $331,800 | $140,300 | $191,500 |
| 2018 | $5,979 | $331,800 | $140,300 | $191,500 |
| 2017 | $5,351 | $290,500 | $121,600 | $168,900 |
| 2016 | $5,066 | $290,500 | $121,600 | $168,900 |
| 2015 | $4,939 | $290,500 | $121,600 | $168,900 |
Source: Public Records
Map
Nearby Homes