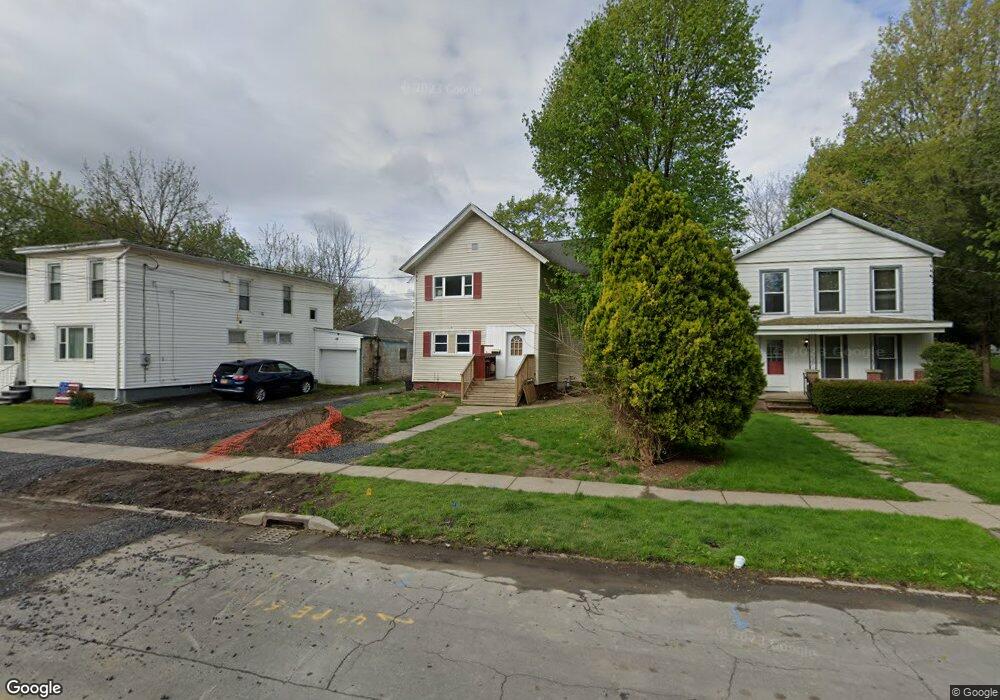
33 Jefferson St Auburn, NY 13021
Estimated Value: $90,000 - $140,000
4
Beds
2
Baths
2,242
Sq Ft
$50/Sq Ft
Est. Value
About This Home
This home is located at 33 Jefferson St, Auburn, NY 13021 and is currently estimated at $111,217, approximately $49 per square foot. 33 Jefferson St is a home located in Cayuga County with nearby schools including Auburn Junior High School, Auburn High School, and Creative Minds Montessori School.
Ownership History
Date
Name
Owned For
Owner Type
Purchase Details
Closed on
Aug 28, 2015
Sold by
Tardibone Steven
Bought by
Petro Rentals Inc
Current Estimated Value
Home Financials for this Owner
Home Financials are based on the most recent Mortgage that was taken out on this home.
Original Mortgage
$2,500,000
Outstanding Balance
$1,974,247
Interest Rate
4.07%
Mortgage Type
Seller Take Back
Estimated Equity
-$1,863,030
Purchase Details
Closed on
Sep 6, 2006
Sold by
Colon Jason
Bought by
Tardibone Steven
Purchase Details
Closed on
Apr 23, 2002
Sold by
Tardibone Steven D
Bought by
Colon Jason
Purchase Details
Closed on
Apr 22, 2002
Sold by
Tardibone Steven D
Bought by
Colon Jason
Purchase Details
Closed on
Aug 22, 2001
Sold by
Green Tree Credit Corp
Bought by
Tardibone Steven
Purchase Details
Closed on
Oct 5, 1999
Purchase Details
Closed on
Apr 23, 1996
Purchase Details
Closed on
Apr 4, 1995
Create a Home Valuation Report for This Property
The Home Valuation Report is an in-depth analysis detailing your home's value as well as a comparison with similar homes in the area
Home Values in the Area
Average Home Value in this Area
Purchase History
| Date | Buyer | Sale Price | Title Company |
|---|---|---|---|
| Petro Rentals Inc | $2,500,000 | None Available | |
| Tardibone Steven | $35,000 | -- | |
| Colon Jason | $28,000 | Howard G Clark | |
| Colon Jason | $28,000 | Howard G Clark | |
| Tardibone Steven | $9,150 | George R Iocolano | |
| -- | $28,533 | -- | |
| -- | $22,050 | -- | |
| -- | $48,076 | -- |
Source: Public Records
Mortgage History
| Date | Status | Borrower | Loan Amount |
|---|---|---|---|
| Open | Petro Rentals Inc | $2,500,000 |
Source: Public Records
Tax History Compared to Growth
Tax History
| Year | Tax Paid | Tax Assessment Tax Assessment Total Assessment is a certain percentage of the fair market value that is determined by local assessors to be the total taxable value of land and additions on the property. | Land | Improvement |
|---|---|---|---|---|
| 2024 | $1,574 | $67,500 | $11,000 | $56,500 |
| 2023 | $1,572 | $67,500 | $11,000 | $56,500 |
| 2022 | $969 | $38,300 | $11,000 | $27,300 |
| 2021 | $1,041 | $38,000 | $10,000 | $28,000 |
| 2020 | $1,624 | $60,000 | $10,000 | $50,000 |
| 2019 | $510 | $60,000 | $10,000 | $50,000 |
| 2018 | $1,526 | $60,000 | $10,000 | $50,000 |
| 2017 | $1,396 | $51,000 | $10,400 | $40,600 |
| 2016 | $1,797 | $51,000 | $10,400 | $40,600 |
| 2015 | $844 | $51,000 | $10,400 | $40,600 |
| 2014 | $844 | $51,000 | $10,400 | $40,600 |
Source: Public Records
Map
Nearby Homes
- 43 Jefferson St
- 77 Orchard St
- 81 Orchard St
- 7 Orchard Ave
- 12 Orchard Ave
- 16 Orchard Ave
- 5 West St
- 47 West St Unit 49
- 7 Barber St
- 22 Baker Ave Unit 20
- 8/151/9-11 Spring State Aurelius St
- 8 Spring St
- 21-23 Derby Ave
- 0 N Division St Unit S1471491
- 107-109 Wall St
- 177 Genesee St
- 114-116 Ross Place
- 6 Brookfield Place
- 50 N Division St
- 99 Washington St
- 35 Jefferson St
- 31 Jefferson St
- 39 Jefferson St
- 29 Jefferson St
- 63 Orchard St Unit 65
- 41 Jefferson St
- 61 Orchard St
- 59 Orchard St
- 67 Orchard St
- 42 Jefferson St
- 48 Jefferson St
- 46 Jefferson St
- 40 Jefferson St
- 69 Orchard St Unit 71
- 38 Jefferson St
- 50 Jefferson St
- 45 Jefferson St Unit 1
- 45 Jefferson St Unit 2
- 45 Jefferson St
- 45 Jefferson St Unit 3