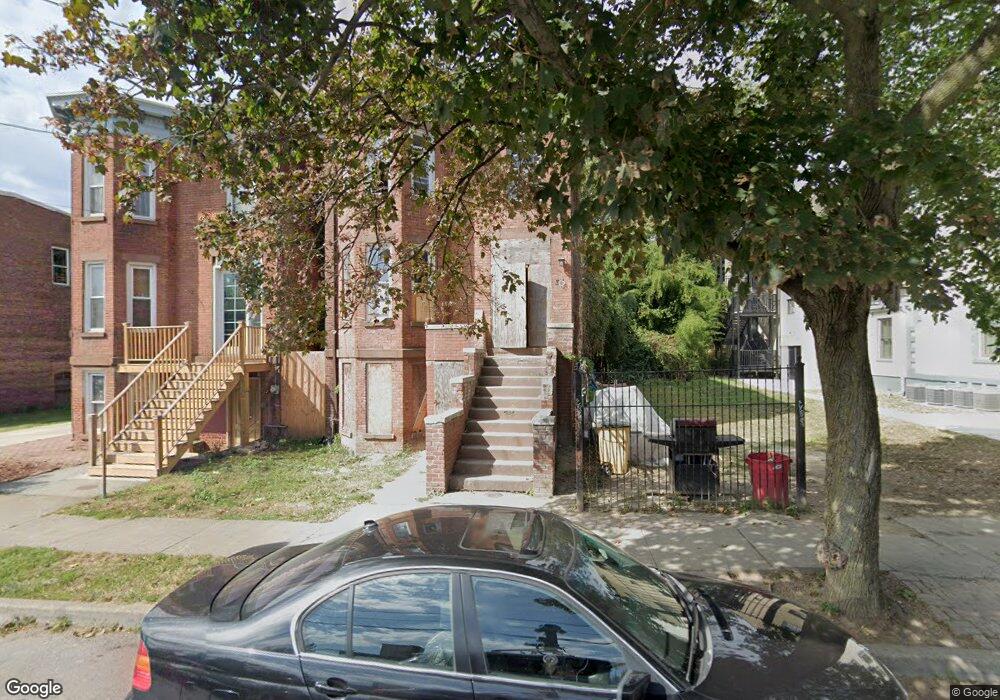
33 Johnston St Newburgh, NY 12550
Estimated Value: $360,000 - $471,000
6
Beds
3
Baths
1,908
Sq Ft
$224/Sq Ft
Est. Value
About This Home
This home is located at 33 Johnston St, Newburgh, NY 12550 and is currently estimated at $426,667, approximately $223 per square foot. 33 Johnston St is a home located in Orange County with nearby schools including Newburgh Free Academy Main Campus, Bishop Dunn Memorial, and San Miguel Academy Of Newburgh.
Ownership History
Date
Name
Owned For
Owner Type
Purchase Details
Closed on
Mar 9, 2020
Sold by
Otherside Properties Llc
Bought by
New Hudson Llc
Current Estimated Value
Home Financials for this Owner
Home Financials are based on the most recent Mortgage that was taken out on this home.
Original Mortgage
$485,000
Interest Rate
3.2%
Mortgage Type
New Conventional
Purchase Details
Closed on
Aug 23, 2018
Sold by
Newburgh Property Mgmt
Bought by
Otherside Properties Llc
Home Financials for this Owner
Home Financials are based on the most recent Mortgage that was taken out on this home.
Original Mortgage
$117,500
Interest Rate
4.5%
Mortgage Type
New Conventional
Purchase Details
Closed on
Jan 7, 2005
Sold by
Mechalovich Raanan
Bought by
Wei Liren
Purchase Details
Closed on
Feb 3, 2004
Sold by
33 Johnston Corp
Bought by
Mechalovich Raanan
Create a Home Valuation Report for This Property
The Home Valuation Report is an in-depth analysis detailing your home's value as well as a comparison with similar homes in the area
Home Values in the Area
Average Home Value in this Area
Purchase History
| Date | Buyer | Sale Price | Title Company |
|---|---|---|---|
| New Hudson Llc | -- | None Available | |
| Otherside Properties Llc | $82,500 | -- | |
| Wei Liren | $186,000 | Mark G Aberasturi | |
| Mechalovich Raanan | -- | Daniel J Bloom |
Source: Public Records
Mortgage History
| Date | Status | Borrower | Loan Amount |
|---|---|---|---|
| Previous Owner | New Hudson Llc | $485,000 | |
| Previous Owner | Otherside Properties Llc | $117,500 |
Source: Public Records
Tax History Compared to Growth
Tax History
| Year | Tax Paid | Tax Assessment Tax Assessment Total Assessment is a certain percentage of the fair market value that is determined by local assessors to be the total taxable value of land and additions on the property. | Land | Improvement |
|---|---|---|---|---|
| 2024 | $9,220 | $396,000 | $23,200 | $372,800 |
| 2023 | $9,220 | $360,000 | $23,200 | $336,800 |
| 2022 | $8,696 | $270,000 | $11,200 | $258,800 |
| 2021 | $10,496 | $225,000 | $10,200 | $214,800 |
| 2020 | $3,302 | $95,900 | $10,200 | $85,700 |
| 2019 | $1,041 | $48,700 | $10,200 | $38,500 |
| 2018 | $1,041 | $44,300 | $10,900 | $33,400 |
| 2017 | $2,247 | $44,300 | $10,900 | $33,400 |
| 2016 | $2,292 | $44,300 | $10,900 | $33,400 |
| 2015 | -- | $48,200 | $10,900 | $37,300 |
| 2014 | -- | $53,600 | $10,900 | $42,700 |
Source: Public Records
Map
Nearby Homes
- 31 Johnston St
- 27 Johnston St
- 39 Johnston St
- 25 Johnston St
- 43 Johnston St
- 43 Johnston St Unit 1
- 43 Johnston St Unit 1
- 40 S Miller St Unit 3
- 40 S Miller St
- 34 S Miller St
- 36 S Miller St
- 32 S Miller St
- 38 S Miller St
- 23 Johnston St
- 30 S Miller St
- 28 S Miller St
- 45 Johnston St
- 26 S Miller St
- 44 S Miller St
- 19 Johnston St