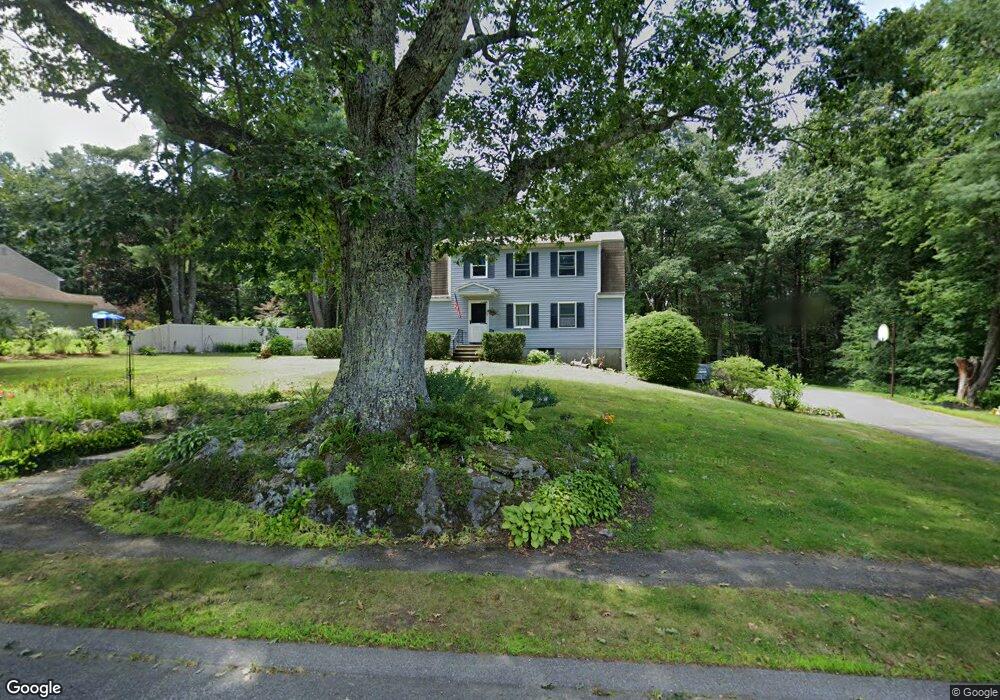
33 Keep Ave Paxton, MA 01612
Estimated Value: $561,000 - $665,000
4
Beds
3
Baths
2,179
Sq Ft
$278/Sq Ft
Est. Value
About This Home
This home is located at 33 Keep Ave, Paxton, MA 01612 and is currently estimated at $606,354, approximately $278 per square foot. 33 Keep Ave is a home located in Worcester County with nearby schools including Wachusett Regional High School.
Ownership History
Date
Name
Owned For
Owner Type
Purchase Details
Closed on
Feb 25, 1999
Sold by
Mcdonald Pamela G
Bought by
Tasca Jeffrey M and Haman Roberley E
Current Estimated Value
Home Financials for this Owner
Home Financials are based on the most recent Mortgage that was taken out on this home.
Original Mortgage
$171,000
Interest Rate
6.78%
Mortgage Type
Purchase Money Mortgage
Create a Home Valuation Report for This Property
The Home Valuation Report is an in-depth analysis detailing your home's value as well as a comparison with similar homes in the area
Home Values in the Area
Average Home Value in this Area
Purchase History
| Date | Buyer | Sale Price | Title Company |
|---|---|---|---|
| Tasca Jeffrey M | $180,000 | -- |
Source: Public Records
Mortgage History
| Date | Status | Borrower | Loan Amount |
|---|---|---|---|
| Open | Tasca Jeffrey M | $208,000 | |
| Closed | Tasca Jeffrey M | $171,000 | |
| Previous Owner | Tasca Jeffrey M | $70,000 |
Source: Public Records
Tax History
| Year | Tax Paid | Tax Assessment Tax Assessment Total Assessment is a certain percentage of the fair market value that is determined by local assessors to be the total taxable value of land and additions on the property. | Land | Improvement |
|---|---|---|---|---|
| 2025 | $7,212 | $489,300 | $120,400 | $368,900 |
| 2024 | $7,304 | $454,500 | $120,400 | $334,100 |
| 2023 | $7,051 | $401,100 | $109,700 | $291,400 |
| 2022 | $6,802 | $358,400 | $109,700 | $248,700 |
| 2021 | $6,481 | $328,500 | $100,200 | $228,300 |
| 2020 | $6,308 | $319,700 | $91,400 | $228,300 |
| 2019 | $6,149 | $311,500 | $83,200 | $228,300 |
| 2018 | $101 | $280,700 | $80,100 | $200,600 |
| 2017 | $5,554 | $272,400 | $76,300 | $196,100 |
| 2016 | $5,450 | $264,700 | $76,300 | $188,400 |
| 2015 | $5,362 | $257,900 | $76,300 | $181,600 |
| 2014 | $5,199 | $253,500 | $76,400 | $177,100 |
Source: Public Records
Map
Nearby Homes
- 230 West St
- 620 Pleasant St
- 11 Brigham Rd
- LOT 8 Pierre Cir
- 289 Richards Ave
- 2 Hemlock St
- 8 Hemlock St
- 41 Hill St
- 2 Kosta Ave
- 106 Paxton Rd
- 14A Welch Ave Unit A
- 7 Emerald Rd
- 196 N Spencer Rd
- Lot 6 Irish Ln
- 236 Turkey Hill Rd
- 21 Wildbrook Dr
- 17 Walbridge Rd
- 311 Pleasantdale Rd
- 12 Point Eastalee Dr
- 140 Paxton Rd
Your Personal Tour Guide
Ask me questions while you tour the home.