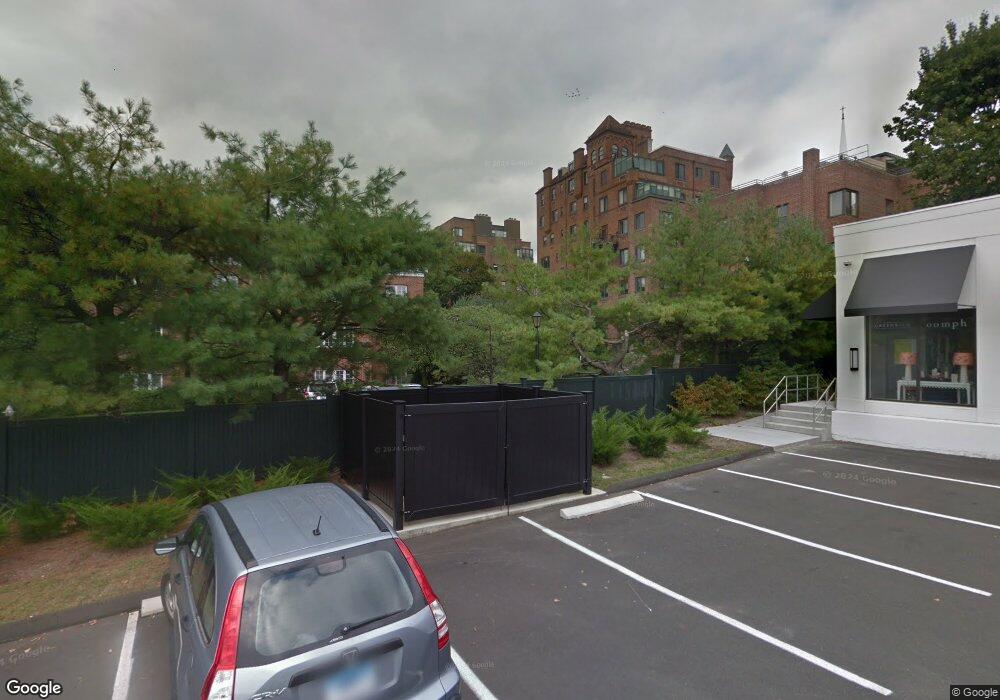
33 Lafayette Ct Unit 2B Greenwich, CT 06830
Mid-Country East NeighborhoodEstimated Value: $1,166,047 - $1,336,000
1
Bed
2
Baths
1,400
Sq Ft
$887/Sq Ft
Est. Value
About This Home
This home is located at 33 Lafayette Ct Unit 2B, Greenwich, CT 06830 and is currently estimated at $1,242,012, approximately $887 per square foot. 33 Lafayette Ct Unit 2B is a home located in Fairfield County with nearby schools including North Street School, Central Middle School, and Greenwich High School.
Ownership History
Date
Name
Owned For
Owner Type
Purchase Details
Closed on
Jun 24, 2011
Sold by
Garrick Salli Est
Bought by
Lennon-Williams Nell
Current Estimated Value
Purchase Details
Closed on
Sep 9, 1997
Sold by
Swartz Tr Ethel S
Bought by
Garrick Salli
Home Financials for this Owner
Home Financials are based on the most recent Mortgage that was taken out on this home.
Original Mortgage
$100,000
Interest Rate
7.36%
Mortgage Type
Unknown
Purchase Details
Closed on
Sep 14, 1994
Sold by
Fudali Theodore and Bergacs Fudali Kathy
Bought by
Swartz Tr Ethel S
Purchase Details
Closed on
Oct 15, 1993
Sold by
Mayfair Ct Assoc Lp
Bought by
Fudali Theodore and Fudali Kathy
Home Financials for this Owner
Home Financials are based on the most recent Mortgage that was taken out on this home.
Original Mortgage
$150,000
Interest Rate
6.87%
Mortgage Type
Unknown
Create a Home Valuation Report for This Property
The Home Valuation Report is an in-depth analysis detailing your home's value as well as a comparison with similar homes in the area
Home Values in the Area
Average Home Value in this Area
Purchase History
| Date | Buyer | Sale Price | Title Company |
|---|---|---|---|
| Lennon-Williams Nell | -- | -- | |
| Lennon-Williams Nell | -- | -- | |
| Garrick Salli | $282,500 | -- | |
| Swartz Tr Ethel S | $260,000 | -- | |
| Fudali Theodore | $207,000 | -- |
Source: Public Records
Mortgage History
| Date | Status | Borrower | Loan Amount |
|---|---|---|---|
| Previous Owner | Fudali Theodore | $233,395 | |
| Previous Owner | Fudali Theodore | $100,000 | |
| Previous Owner | Fudali Theodore | $150,000 |
Source: Public Records
Tax History Compared to Growth
Tax History
| Year | Tax Paid | Tax Assessment Tax Assessment Total Assessment is a certain percentage of the fair market value that is determined by local assessors to be the total taxable value of land and additions on the property. | Land | Improvement |
|---|---|---|---|---|
| 2025 | $6,288 | $508,760 | $0 | $508,760 |
| 2024 | $6,073 | $508,760 | $0 | $508,760 |
| 2023 | $5,920 | $508,760 | $0 | $508,760 |
| 2022 | $5,866 | $508,760 | $0 | $508,760 |
| 2021 | $5,764 | $478,730 | $0 | $478,730 |
| 2020 | $5,754 | $478,730 | $0 | $478,730 |
| 2019 | $5,812 | $478,730 | $0 | $478,730 |
| 2018 | $5,683 | $478,730 | $0 | $478,730 |
| 2017 | $5,754 | $478,730 | $0 | $478,730 |
| 2016 | $5,663 | $478,730 | $0 | $478,730 |
| 2015 | $5,994 | $502,600 | $0 | $502,600 |
| 2014 | $5,843 | $502,600 | $0 | $502,600 |
Source: Public Records
Map
Nearby Homes
- 4 Lafayette Ct Unit PH
- 4 Lafayette Ct Unit 1C
- 15 Lafayette Ct Unit 4D
- 47 Lafayette Place Unit 4J
- 20 Church St Unit A22
- 20 Church St Unit A15
- 20 Church St Unit B6
- 20 Church St Unit A34
- 68 Dearfield Dr
- 75 Mason St
- 63 Church St Unit A
- 6 Benedict Place
- 25 W Elm St Unit 36
- 48 Lexington Ave
- 30 Milbank Ave
- 65 Sherwood Place
- 21 Northfield St
- 44 Northfield St
- 22 Carleton St
- 10 Carleton St
- 33 Lafayette Ct Unit 3H
- 33 Lafayette Ct Unit 3G
- 33 Lafayette Ct Unit 3F
- 33 Lafayette Ct Unit 3E
- 33 Lafayette Ct Unit 3D
- 33 Lafayette Ct Unit 3C
- 33 Lafayette Ct Unit 3B
- 33 Lafayette Ct Unit 3A
- 33 Lafayette Ct Unit 2H
- 33 Lafayette Ct Unit 2F
- 33 Lafayette Ct Unit 2E
- 33 Lafayette Ct Unit 2D
- 33 Lafayette Ct Unit 2C
- 33 Lafayette Ct Unit 2A
- 33 Lafayette Ct Unit 1H
- 33 Lafayette Ct Unit 1G
- 33 Lafayette Ct Unit 1F
- 33 Lafayette Ct Unit 1E
- 33 Lafayette Ct Unit 1D
- 33 Lafayette Ct Unit 1C