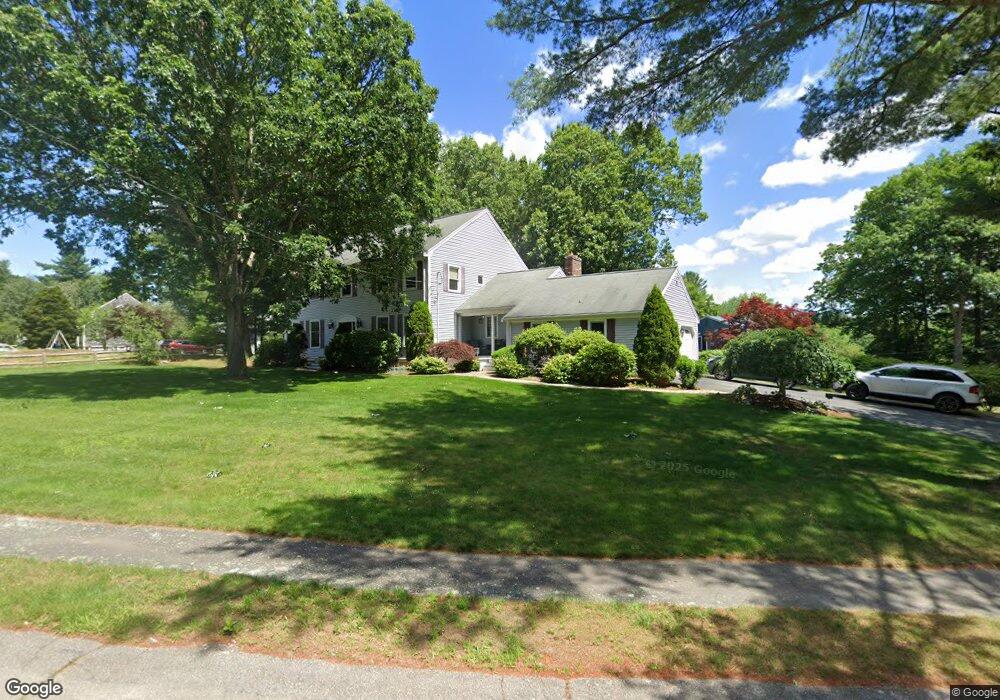
33 Leo Way East Bridgewater, MA 02333
Estimated Value: $841,000 - $1,138,000
6
Beds
3
Baths
4,100
Sq Ft
$227/Sq Ft
Est. Value
About This Home
This home is located at 33 Leo Way, East Bridgewater, MA 02333 and is currently estimated at $930,383, approximately $226 per square foot. 33 Leo Way is a home located in Plymouth County with nearby schools including Central Elementary School, Gordon W Mitchell Middle School, and East Bridgewater Jr./Sr. High School.
Ownership History
Date
Name
Owned For
Owner Type
Purchase Details
Closed on
Jun 30, 2005
Sold by
Marotta Gary J and Marotta Judith L
Bought by
Franchi Paul and Bourgea Katherine
Current Estimated Value
Purchase Details
Closed on
Jun 30, 1998
Sold by
Narcotta Marilyn E and Narcotta John C
Bought by
Marotta Judith L and Marotta Gary J
Create a Home Valuation Report for This Property
The Home Valuation Report is an in-depth analysis detailing your home's value as well as a comparison with similar homes in the area
Home Values in the Area
Average Home Value in this Area
Purchase History
| Date | Buyer | Sale Price | Title Company |
|---|---|---|---|
| Franchi Paul | $599,900 | -- | |
| Marotta Judith L | $249,000 | -- |
Source: Public Records
Mortgage History
| Date | Status | Borrower | Loan Amount |
|---|---|---|---|
| Open | Marotta Judith L | $139,000 | |
| Closed | Marotta Judith L | $40,000 |
Source: Public Records
Tax History Compared to Growth
Tax History
| Year | Tax Paid | Tax Assessment Tax Assessment Total Assessment is a certain percentage of the fair market value that is determined by local assessors to be the total taxable value of land and additions on the property. | Land | Improvement |
|---|---|---|---|---|
| 2025 | $10,402 | $760,900 | $227,600 | $533,300 |
| 2024 | $10,224 | $738,700 | $218,800 | $519,900 |
| 2023 | $9,924 | $686,800 | $218,800 | $468,000 |
| 2022 | $9,291 | $595,600 | $182,500 | $413,100 |
| 2021 | $9,144 | $536,300 | $175,300 | $361,000 |
| 2020 | $8,918 | $515,800 | $168,600 | $347,200 |
| 2019 | $8,640 | $492,000 | $161,100 | $330,900 |
| 2018 | $8,567 | $477,000 | $161,100 | $315,900 |
| 2017 | $8,321 | $454,700 | $153,700 | $301,000 |
| 2016 | $7,978 | $439,300 | $153,700 | $285,600 |
| 2015 | $7,747 | $436,200 | $152,600 | $283,600 |
| 2014 | $7,440 | $428,300 | $149,400 | $278,900 |
Source: Public Records
Map
Nearby Homes