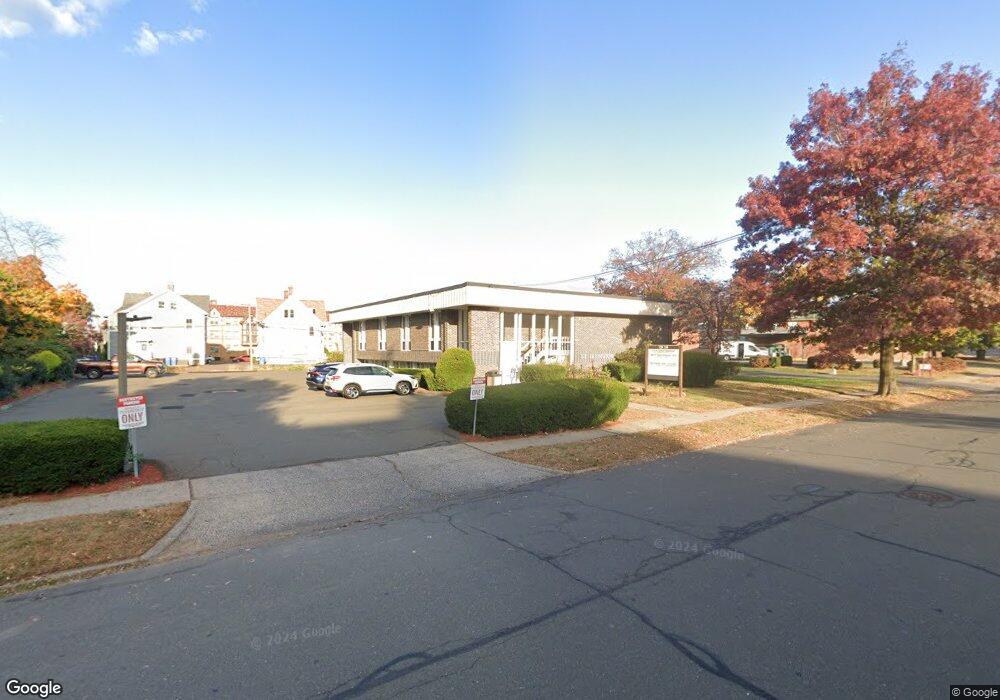
33 Lexington St New Britain, CT 06052
Estimated Value: $3,340,981
--
Bed
--
Bath
7,687
Sq Ft
$435/Sq Ft
Est. Value
About This Home
This home is located at 33 Lexington St, New Britain, CT 06052 and is currently estimated at $3,340,981, approximately $434 per square foot. 33 Lexington St is a home located in Hartford County with nearby schools including Lincoln School, Slade Middle School, and Mountain Laurel Sudbury School.
Ownership History
Date
Name
Owned For
Owner Type
Purchase Details
Closed on
Mar 11, 2013
Sold by
Group Lexington
Bought by
33 Lexington Street Ll
Current Estimated Value
Home Financials for this Owner
Home Financials are based on the most recent Mortgage that was taken out on this home.
Original Mortgage
$120,000
Interest Rate
4.25%
Mortgage Type
Commercial
Purchase Details
Closed on
Dec 23, 1988
Sold by
Lexington Assoc
Bought by
Mcauliffe Gerald V
Create a Home Valuation Report for This Property
The Home Valuation Report is an in-depth analysis detailing your home's value as well as a comparison with similar homes in the area
Home Values in the Area
Average Home Value in this Area
Purchase History
| Date | Buyer | Sale Price | Title Company |
|---|---|---|---|
| 33 Lexington Street Ll | -- | -- | |
| 33 Lexington Street Ll | -- | -- | |
| Mcauliffe Gerald V | $750,000 | -- |
Source: Public Records
Mortgage History
| Date | Status | Borrower | Loan Amount |
|---|---|---|---|
| Closed | Mcauliffe Gerald V | $120,000 |
Source: Public Records
Tax History Compared to Growth
Tax History
| Year | Tax Paid | Tax Assessment Tax Assessment Total Assessment is a certain percentage of the fair market value that is determined by local assessors to be the total taxable value of land and additions on the property. | Land | Improvement |
|---|---|---|---|---|
| 2025 | $21,121 | $539,070 | $133,280 | $405,790 |
| 2024 | $21,342 | $539,070 | $133,280 | $405,790 |
| 2023 | $20,636 | $539,070 | $133,280 | $405,790 |
| 2022 | $25,346 | $512,050 | $116,900 | $395,150 |
| 2021 | $25,346 | $512,050 | $116,900 | $395,150 |
| 2020 | $25,859 | $512,050 | $116,900 | $395,150 |
| 2019 | $25,859 | $512,050 | $116,900 | $395,150 |
| 2018 | $25,859 | $512,050 | $116,900 | $395,150 |
| 2017 | $24,985 | $494,760 | $111,300 | $383,460 |
| 2016 | $24,985 | $494,760 | $111,300 | $383,460 |
| 2015 | $24,243 | $494,760 | $111,300 | $383,460 |
| 2014 | $24,243 | $494,760 | $111,300 | $383,460 |
Source: Public Records
Map
Nearby Homes