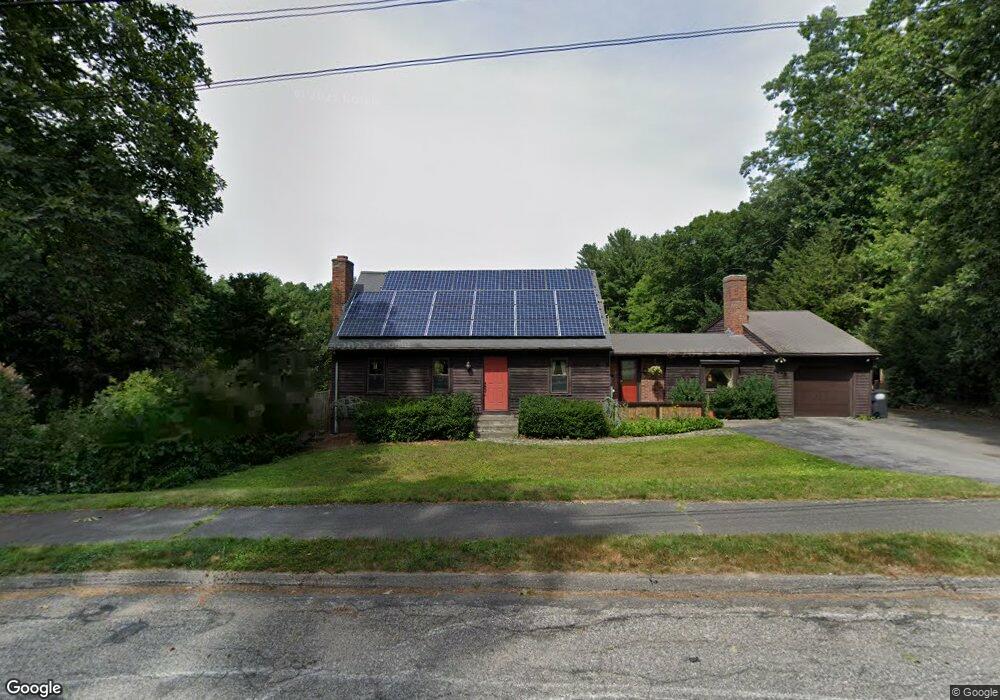
33 Linda St Westborough, MA 01581
Estimated Value: $742,000 - $948,000
4
Beds
3
Baths
2,598
Sq Ft
$323/Sq Ft
Est. Value
About This Home
This home is located at 33 Linda St, Westborough, MA 01581 and is currently estimated at $839,444, approximately $323 per square foot. 33 Linda St is a home located in Worcester County with nearby schools including Westborough High School and Al-Hamra Academy.
Ownership History
Date
Name
Owned For
Owner Type
Purchase Details
Closed on
Aug 17, 2005
Sold by
Ruth D Butler T
Bought by
Rush John E and Freeman Lisa M
Current Estimated Value
Home Financials for this Owner
Home Financials are based on the most recent Mortgage that was taken out on this home.
Original Mortgage
$333,000
Outstanding Balance
$174,929
Interest Rate
5.66%
Mortgage Type
Purchase Money Mortgage
Estimated Equity
$664,515
Create a Home Valuation Report for This Property
The Home Valuation Report is an in-depth analysis detailing your home's value as well as a comparison with similar homes in the area
Home Values in the Area
Average Home Value in this Area
Purchase History
| Date | Buyer | Sale Price | Title Company |
|---|---|---|---|
| Rush John E | $540,000 | -- |
Source: Public Records
Mortgage History
| Date | Status | Borrower | Loan Amount |
|---|---|---|---|
| Open | Rush John E | $333,000 |
Source: Public Records
Tax History Compared to Growth
Tax History
| Year | Tax Paid | Tax Assessment Tax Assessment Total Assessment is a certain percentage of the fair market value that is determined by local assessors to be the total taxable value of land and additions on the property. | Land | Improvement |
|---|---|---|---|---|
| 2025 | $11,568 | $710,100 | $381,100 | $329,000 |
| 2024 | $11,185 | $681,600 | $363,700 | $317,900 |
| 2023 | $10,528 | $625,200 | $344,100 | $281,100 |
| 2022 | $10,125 | $547,600 | $285,300 | $262,300 |
| 2021 | $9,615 | $518,600 | $259,200 | $259,400 |
| 2020 | $9,420 | $514,200 | $254,800 | $259,400 |
| 2019 | $9,161 | $499,800 | $252,600 | $247,200 |
| 2018 | $2,736 | $472,000 | $243,900 | $228,100 |
| 2017 | $2,527 | $472,000 | $243,900 | $228,100 |
| 2016 | $8,082 | $454,800 | $237,400 | $217,400 |
| 2015 | $7,843 | $421,900 | $224,300 | $197,600 |
Source: Public Records
Map
Nearby Homes