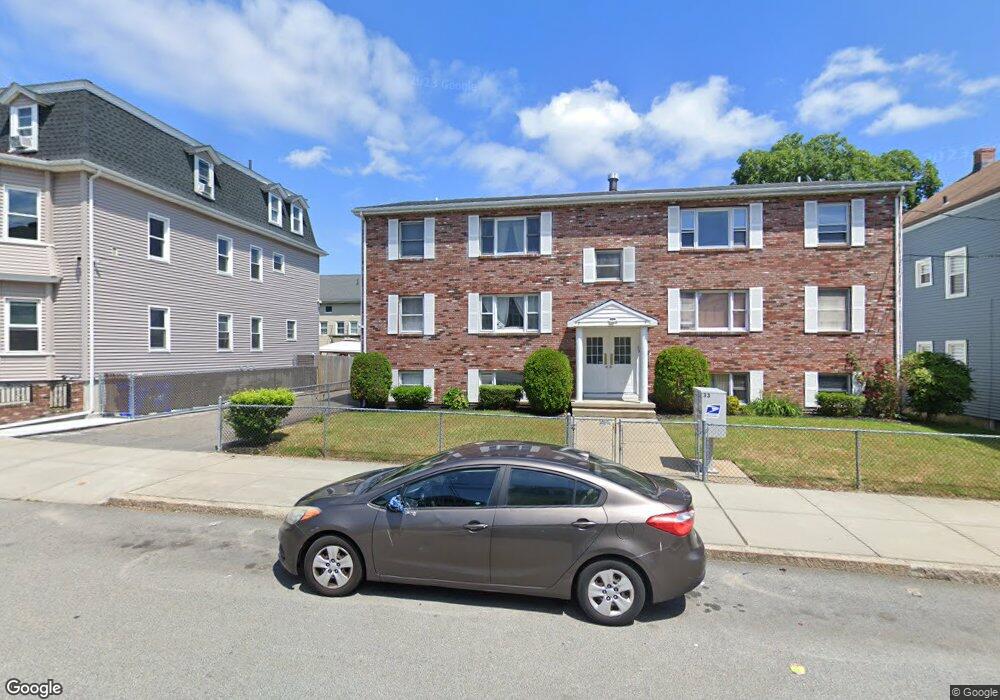
33 Linden St Unit 1 Fall River, MA 02720
Bank Street NeighborhoodEstimated Value: $190,000 - $230,000
2
Beds
1
Bath
708
Sq Ft
$294/Sq Ft
Est. Value
About This Home
This home is located at 33 Linden St Unit 1, Fall River, MA 02720 and is currently estimated at $208,409, approximately $294 per square foot. 33 Linden St Unit 1 is a home located in Bristol County with nearby schools including Mary Fonseca Elementary School, Morton Middle School, and B M C Durfee High School.
Ownership History
Date
Name
Owned For
Owner Type
Purchase Details
Closed on
Apr 27, 2024
Sold by
Paull Jonathan E
Bought by
Alonso-Paull Ft and Alonso
Current Estimated Value
Purchase Details
Closed on
Nov 22, 2002
Sold by
Contreras Joseph Anthony
Bought by
Paull Jonathan E
Home Financials for this Owner
Home Financials are based on the most recent Mortgage that was taken out on this home.
Original Mortgage
$69,000
Interest Rate
6.07%
Mortgage Type
Purchase Money Mortgage
Purchase Details
Closed on
Jan 10, 1994
Sold by
Fnma
Bought by
Contreras Joseph A
Home Financials for this Owner
Home Financials are based on the most recent Mortgage that was taken out on this home.
Original Mortgage
$42,275
Interest Rate
7.23%
Mortgage Type
Purchase Money Mortgage
Purchase Details
Closed on
Jun 9, 1993
Sold by
Silvia Edward A
Bought by
Gmac Mtg Corp Of Iowa
Create a Home Valuation Report for This Property
The Home Valuation Report is an in-depth analysis detailing your home's value as well as a comparison with similar homes in the area
Home Values in the Area
Average Home Value in this Area
Purchase History
| Date | Buyer | Sale Price | Title Company |
|---|---|---|---|
| Alonso-Paull Ft | -- | None Available | |
| Alonso-Paull Ft | -- | None Available | |
| Paull Jonathan E | $69,000 | -- | |
| Paull Jonathan E | $69,000 | -- | |
| Contreras Joseph A | $44,500 | -- | |
| Contreras Joseph A | $44,500 | -- | |
| Gmac Mtg Corp Of Iowa | $52,601 | -- | |
| Gmac Mtg Corp Of Iowa | $52,601 | -- |
Source: Public Records
Mortgage History
| Date | Status | Borrower | Loan Amount |
|---|---|---|---|
| Previous Owner | Gmac Mtg Corp Of Iowa | $69,000 | |
| Previous Owner | Gmac Mtg Corp Of Iowa | $42,275 |
Source: Public Records
Tax History
| Year | Tax Paid | Tax Assessment Tax Assessment Total Assessment is a certain percentage of the fair market value that is determined by local assessors to be the total taxable value of land and additions on the property. | Land | Improvement |
|---|---|---|---|---|
| 2025 | $1,487 | $129,900 | $0 | $129,900 |
| 2024 | $1,445 | $125,800 | $0 | $125,800 |
| 2023 | $1,398 | $113,900 | $0 | $113,900 |
| 2022 | $1,482 | $117,400 | $0 | $117,400 |
| 2021 | $1,350 | $97,600 | $0 | $97,600 |
| 2020 | $1,230 | $85,100 | $0 | $85,100 |
| 2019 | $1,194 | $81,900 | $0 | $81,900 |
| 2018 | $1,164 | $79,600 | $0 | $79,600 |
| 2017 | $1,138 | $81,300 | $0 | $81,300 |
| 2016 | $1,077 | $79,000 | $0 | $79,000 |
| 2015 | $1,056 | $80,700 | $0 | $80,700 |
| 2014 | $1,094 | $87,000 | $0 | $87,000 |
Source: Public Records
Map
Nearby Homes
- 511 Bank St
- 464 Bank St Unit 10
- 89 Oak St
- 104 Oak St
- 501 Pine St
- 233 Franklin St
- 229 Franklin St
- 528 Cherry St Unit 3
- 243 Robeson St Unit 6
- 243 Robeson St Unit 3
- 275 Bank St
- 273 Tremont St
- 631 Walnut St
- 884 Cherry St
- 610 Walnut St
- 150 Purchase St
- 360 High St
- 120 15th St Unit 5
- 992 Pine St
- 105 16th St
- 33 Linden St
- 33 Linden St Unit 6
- 33 Linden St Unit 5
- 33 Linden St Unit D
- 33 Linden St Unit 3
- 33 Linden St Unit 2
- 33 Linden St Unit 2B
- 33 Linden St Unit B
- 33 Linden St Unit F
- 47 Linden St
- 23 Linden St
- 49 Linden St Unit 2
- 49 Linden St
- 17 Linden St
- 24 - 34 Linden St
- 98 Seabury St
- 57 Linden St
- 65 Linden St Unit 1 East
- 65 Linden St Unit 1 West
- 65 Linden St
Your Personal Tour Guide
Ask me questions while you tour the home.