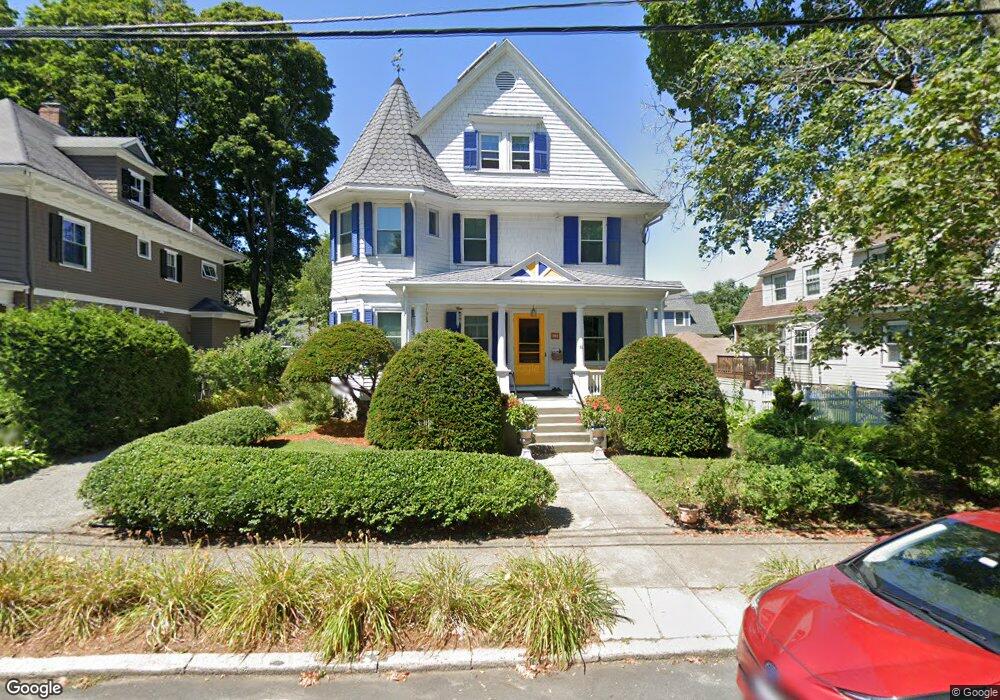
33 Lloyd St Winchester, MA 01890
Estimated Value: $1,545,404 - $1,672,000
5
Beds
3
Baths
2,639
Sq Ft
$613/Sq Ft
Est. Value
About This Home
This home is located at 33 Lloyd St, Winchester, MA 01890 and is currently estimated at $1,618,601, approximately $613 per square foot. 33 Lloyd St is a home located in Middlesex County with nearby schools including Lincoln Elementary School, McCall Middle School, and Winchester High School.
Ownership History
Date
Name
Owned For
Owner Type
Purchase Details
Closed on
Aug 2, 1999
Sold by
Coonley Helen W
Bought by
Coonley Philip S
Current Estimated Value
Home Financials for this Owner
Home Financials are based on the most recent Mortgage that was taken out on this home.
Original Mortgage
$310,000
Outstanding Balance
$88,805
Interest Rate
7.61%
Mortgage Type
Purchase Money Mortgage
Estimated Equity
$1,529,796
Create a Home Valuation Report for This Property
The Home Valuation Report is an in-depth analysis detailing your home's value as well as a comparison with similar homes in the area
Purchase History
| Date | Buyer | Sale Price | Title Company |
|---|---|---|---|
| Coonley Philip S | $182,255 | -- |
Source: Public Records
Mortgage History
| Date | Status | Borrower | Loan Amount |
|---|---|---|---|
| Open | Coonley Philip S | $310,000 |
Source: Public Records
Tax History
| Year | Tax Paid | Tax Assessment Tax Assessment Total Assessment is a certain percentage of the fair market value that is determined by local assessors to be the total taxable value of land and additions on the property. | Land | Improvement |
|---|---|---|---|---|
| 2025 | $149 | $1,341,000 | $832,900 | $508,100 |
| 2024 | $14,204 | $1,253,700 | $773,400 | $480,300 |
| 2023 | $13,970 | $1,183,900 | $713,900 | $470,000 |
| 2022 | $13,531 | $1,081,600 | $624,600 | $457,000 |
| 2021 | $35,136 | $1,029,600 | $572,600 | $457,000 |
| 2020 | $7,856 | $1,029,600 | $572,600 | $457,000 |
| 2019 | $11,567 | $955,200 | $498,200 | $457,000 |
| 2018 | $5,646 | $931,400 | $474,400 | $457,000 |
| 2017 | $10,956 | $892,200 | $474,400 | $417,800 |
| 2016 | $10,086 | $863,500 | $474,400 | $389,100 |
| 2015 | $9,960 | $820,400 | $431,300 | $389,100 |
| 2014 | $9,195 | $726,300 | $360,700 | $365,600 |
Source: Public Records
Map
Nearby Homes
Your Personal Tour Guide
Ask me questions while you tour the home.