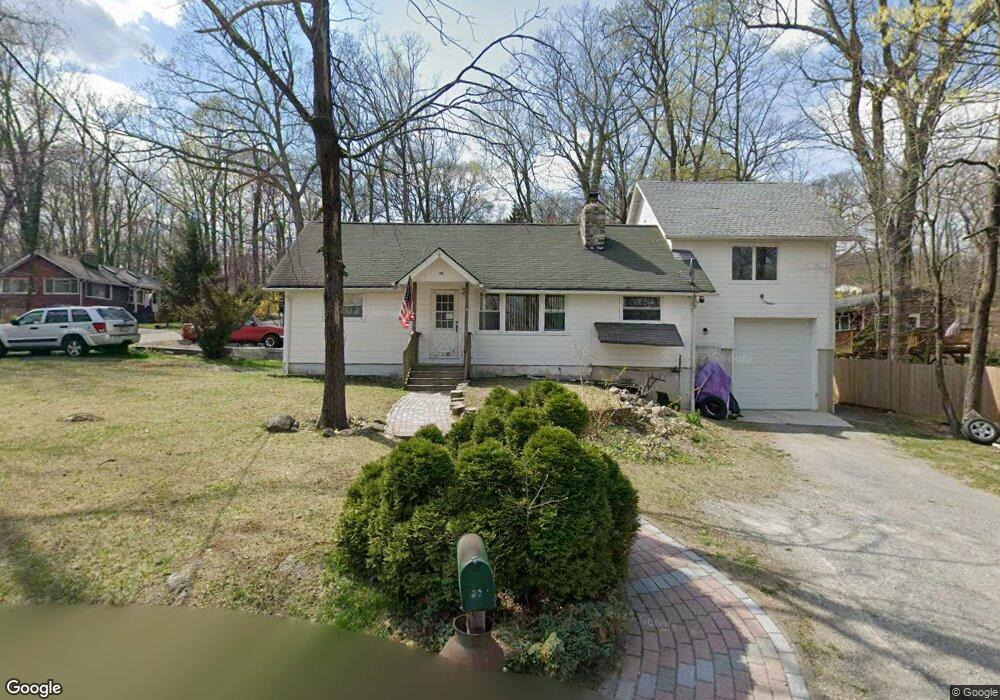
33 Lonaconing Rd Highland Lakes, NJ 07422
Estimated Value: $269,000 - $345,000
--
Bed
--
Bath
1,276
Sq Ft
$253/Sq Ft
Est. Value
About This Home
This home is located at 33 Lonaconing Rd, Highland Lakes, NJ 07422 and is currently estimated at $322,605, approximately $252 per square foot. 33 Lonaconing Rd is a home located in Sussex County with nearby schools including Lounsberry Hollow, Rolling Hills Elementary School, and Glen Meadow School.
Ownership History
Date
Name
Owned For
Owner Type
Purchase Details
Closed on
Aug 19, 2004
Sold by
Barcelo Fortunato and Barcelo Janice
Bought by
Viski Ferenc
Current Estimated Value
Home Financials for this Owner
Home Financials are based on the most recent Mortgage that was taken out on this home.
Original Mortgage
$165,300
Outstanding Balance
$82,025
Interest Rate
6.01%
Mortgage Type
Purchase Money Mortgage
Estimated Equity
$240,580
Purchase Details
Closed on
Feb 23, 2000
Sold by
Barcelo Janice and Barcelo Fortunato
Bought by
Barcelo Janice
Purchase Details
Closed on
Aug 18, 1999
Sold by
Barcelo Janice and Mcmasters Janice B
Bought by
Barcelo Fortunato
Purchase Details
Closed on
Mar 5, 1996
Sold by
Federal National Mortgage Association
Bought by
Mcmasters Janice B
Purchase Details
Closed on
Jun 16, 1995
Sold by
Untig Robert E
Bought by
Federal National Mortgage Association
Create a Home Valuation Report for This Property
The Home Valuation Report is an in-depth analysis detailing your home's value as well as a comparison with similar homes in the area
Home Values in the Area
Average Home Value in this Area
Purchase History
| Date | Buyer | Sale Price | Title Company |
|---|---|---|---|
| Viski Ferenc | $174,000 | -- | |
| Barcelo Janice | -- | -- | |
| Barcelo Fortunato | -- | -- | |
| Mcmasters Janice B | $57,000 | -- | |
| Federal National Mortgage Association | -- | -- |
Source: Public Records
Mortgage History
| Date | Status | Borrower | Loan Amount |
|---|---|---|---|
| Open | Viski Ferenc | $165,300 |
Source: Public Records
Tax History Compared to Growth
Tax History
| Year | Tax Paid | Tax Assessment Tax Assessment Total Assessment is a certain percentage of the fair market value that is determined by local assessors to be the total taxable value of land and additions on the property. | Land | Improvement |
|---|---|---|---|---|
| 2025 | $5,927 | $270,800 | $182,000 | $88,800 |
| 2024 | $5,609 | $242,800 | $162,000 | $80,800 |
| 2023 | $5,609 | $216,300 | $137,000 | $79,300 |
| 2022 | $5,300 | $188,000 | $112,000 | $76,000 |
| 2021 | $4,957 | $157,700 | $86,000 | $71,700 |
| 2020 | $4,539 | $145,000 | $71,000 | $74,000 |
| 2019 | $4,622 | $164,000 | $103,800 | $60,200 |
| 2018 | $4,417 | $164,000 | $103,800 | $60,200 |
| 2017 | $4,298 | $164,000 | $103,800 | $60,200 |
| 2016 | $4,292 | $164,000 | $103,800 | $60,200 |
| 2015 | $4,277 | $164,000 | $103,800 | $60,200 |
| 2014 | $4,316 | $164,000 | $103,800 | $60,200 |
Source: Public Records
Map
Nearby Homes
- 10 Anawa Rd
- 16 Wenatchee Rd
- 51 Lakeside Dr
- 106 Pocantecs Rd
- 8 Shawondasee Rd
- 114 Pocantecs Rd
- 25 Lakeside Dr
- 1 High St4 7forest St
- 134 Birch Rd
- 6 Alamoosook Rd
- 109 Poplar Ln
- 85 Breakneck Rd
- 91 Breakneck Rd
- 507 Abricada Rd
- 503 Pocasset Rd
- 505 Accomac Rd518abri
- 7 Bridge Rd
- 2 Canal St
- 6 Pine St E
- 209 Alturas Rd