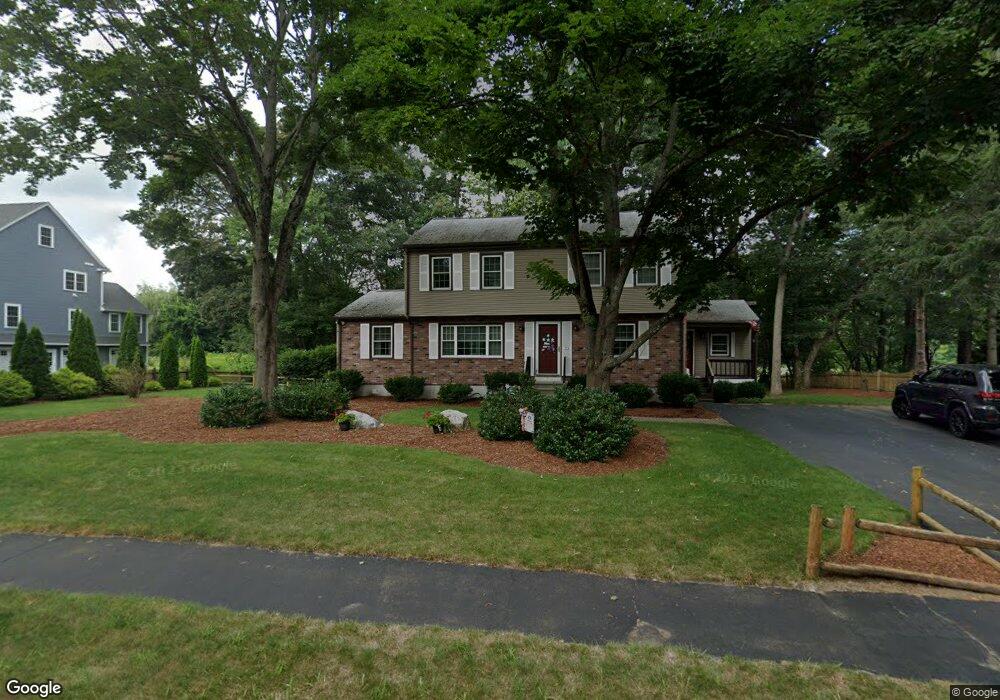
33 Lucaya Cir Wilmington, MA 01887
Estimated Value: $865,058 - $961,000
4
Beds
2
Baths
1,906
Sq Ft
$482/Sq Ft
Est. Value
About This Home
This home is located at 33 Lucaya Cir, Wilmington, MA 01887 and is currently estimated at $918,265, approximately $481 per square foot. 33 Lucaya Cir is a home located in Middlesex County with nearby schools including Wilmington Middle School, Wilmington High School, and N Reading Knowledge Beginnings.
Ownership History
Date
Name
Owned For
Owner Type
Purchase Details
Closed on
Sep 25, 2014
Sold by
Macarthur Kenneth J and Macarthur Pamela Y
Bought by
Spencer Bryan E and Spencer Jennifer M
Current Estimated Value
Home Financials for this Owner
Home Financials are based on the most recent Mortgage that was taken out on this home.
Original Mortgage
$392,000
Outstanding Balance
$300,746
Interest Rate
4.12%
Mortgage Type
New Conventional
Estimated Equity
$617,519
Create a Home Valuation Report for This Property
The Home Valuation Report is an in-depth analysis detailing your home's value as well as a comparison with similar homes in the area
Home Values in the Area
Average Home Value in this Area
Purchase History
| Date | Buyer | Sale Price | Title Company |
|---|---|---|---|
| Spencer Bryan E | $490,000 | -- |
Source: Public Records
Mortgage History
| Date | Status | Borrower | Loan Amount |
|---|---|---|---|
| Open | Spencer Bryan E | $392,000 |
Source: Public Records
Tax History Compared to Growth
Tax History
| Year | Tax Paid | Tax Assessment Tax Assessment Total Assessment is a certain percentage of the fair market value that is determined by local assessors to be the total taxable value of land and additions on the property. | Land | Improvement |
|---|---|---|---|---|
| 2025 | $9,536 | $832,800 | $357,100 | $475,700 |
| 2024 | $9,354 | $818,400 | $357,100 | $461,300 |
| 2023 | $8,487 | $710,800 | $303,200 | $407,600 |
| 2022 | $7,983 | $612,700 | $252,600 | $360,100 |
| 2021 | $7,929 | $572,900 | $229,400 | $343,500 |
| 2020 | $7,618 | $561,000 | $229,400 | $331,600 |
| 2019 | $7,455 | $542,200 | $224,300 | $317,900 |
| 2018 | $7,297 | $506,400 | $213,500 | $292,900 |
| 2017 | $7,148 | $494,700 | $213,500 | $281,200 |
| 2016 | $6,766 | $462,500 | $203,200 | $259,300 |
| 2015 | $6,208 | $432,000 | $203,200 | $228,800 |
| 2014 | $5,784 | $406,200 | $193,400 | $212,800 |
Source: Public Records
Map
Nearby Homes
- 220 Martins Landing Unit 309
- 260 Martins Landing Unit 508
- 260 Martins Landing Unit 103
- 200 Martins Landing Unit 102
- 3 Gordon Rd
- 300 Martins Landing Unit 107
- 320 Martins Landing Unit 311
- 320 Martins Landing Unit 108
- 320 Martins Landing Unit 109
- 320 Martins Landing Unit 110
- 320 Martins Landing Unit 303
- 320 Martins Landing Unit 102
- 320 Martins Landing Unit 103
- 320 Martins Landing Unit 2410
- 320 Martins Landing Unit 403
- 320 Martins Landing Unit 107
- 320 Martins Landing Unit 210
- 320 Martins Landing Unit 2201
- 320 Martins Landing Unit 112
- 320 Martins Landing Unit 206