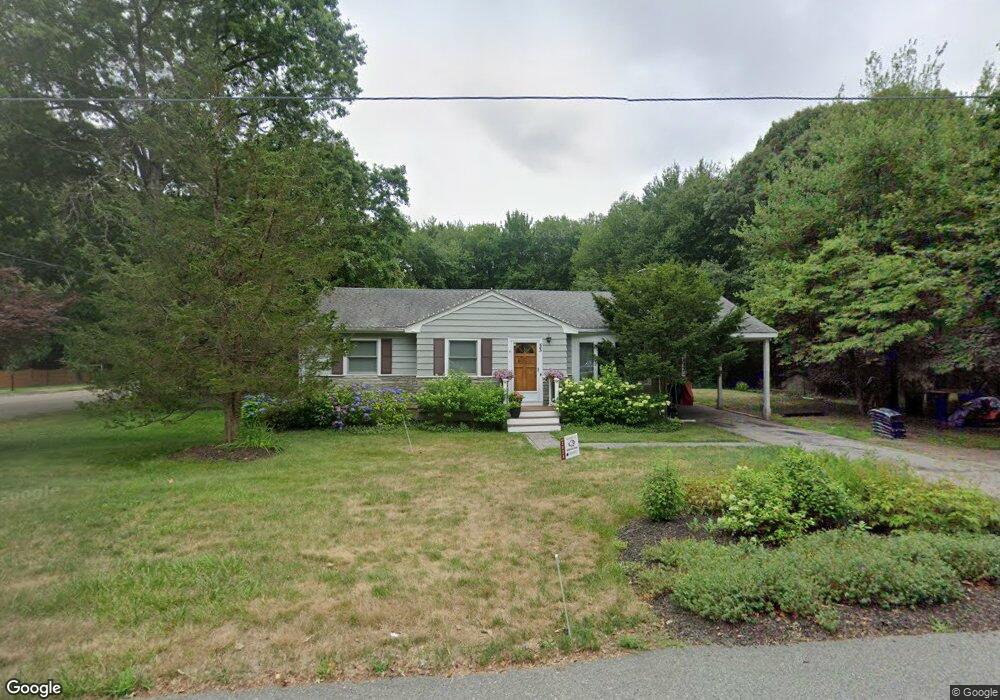
33 Lyndon Rd Sharon, MA 02067
Estimated Value: $586,000 - $645,000
3
Beds
1
Bath
1,120
Sq Ft
$551/Sq Ft
Est. Value
About This Home
This home is located at 33 Lyndon Rd, Sharon, MA 02067 and is currently estimated at $616,630, approximately $550 per square foot. 33 Lyndon Rd is a home located in Norfolk County with nearby schools including East Elementary School, Sharon Middle School, and Sharon High School.
Ownership History
Date
Name
Owned For
Owner Type
Purchase Details
Closed on
Dec 19, 2014
Sold by
Romines Christopher M and Romines Rosenda M
Bought by
Mendoza Ines G and Monsalve Carlos E
Current Estimated Value
Home Financials for this Owner
Home Financials are based on the most recent Mortgage that was taken out on this home.
Original Mortgage
$303,750
Outstanding Balance
$233,526
Interest Rate
4.02%
Mortgage Type
New Conventional
Estimated Equity
$383,104
Purchase Details
Closed on
Apr 29, 1994
Sold by
Campany Nancy J
Bought by
Romines Christopher M and Romines Rosenda M
Create a Home Valuation Report for This Property
The Home Valuation Report is an in-depth analysis detailing your home's value as well as a comparison with similar homes in the area
Home Values in the Area
Average Home Value in this Area
Purchase History
| Date | Buyer | Sale Price | Title Company |
|---|---|---|---|
| Mendoza Ines G | $337,500 | -- | |
| Romines Christopher M | $158,000 | -- |
Source: Public Records
Mortgage History
| Date | Status | Borrower | Loan Amount |
|---|---|---|---|
| Open | Mendoza Ines G | $303,750 | |
| Previous Owner | Romines Christopher M | $123,000 | |
| Previous Owner | Romines Christopher M | $34,000 | |
| Previous Owner | Romines Christopher M | $93,000 |
Source: Public Records
Tax History
| Year | Tax Paid | Tax Assessment Tax Assessment Total Assessment is a certain percentage of the fair market value that is determined by local assessors to be the total taxable value of land and additions on the property. | Land | Improvement |
|---|---|---|---|---|
| 2025 | $10,072 | $576,200 | $419,000 | $157,200 |
| 2024 | $9,593 | $545,700 | $384,400 | $161,300 |
| 2023 | $8,927 | $480,200 | $334,000 | $146,200 |
| 2022 | $8,494 | $430,100 | $278,400 | $151,700 |
| 2021 | $8,211 | $401,900 | $254,300 | $147,600 |
| 2020 | $7,475 | $393,400 | $245,800 | $147,600 |
| 2019 | $7,556 | $389,300 | $250,000 | $139,300 |
| 2018 | $7,446 | $384,400 | $245,100 | $139,300 |
| 2017 | $7,146 | $364,200 | $229,000 | $135,200 |
| 2016 | $7,083 | $352,200 | $229,000 | $123,200 |
| 2015 | $6,486 | $319,500 | $210,100 | $109,400 |
| 2014 | $5,988 | $291,400 | $190,800 | $100,600 |
Source: Public Records
Map
Nearby Homes
Your Personal Tour Guide
Ask me questions while you tour the home.