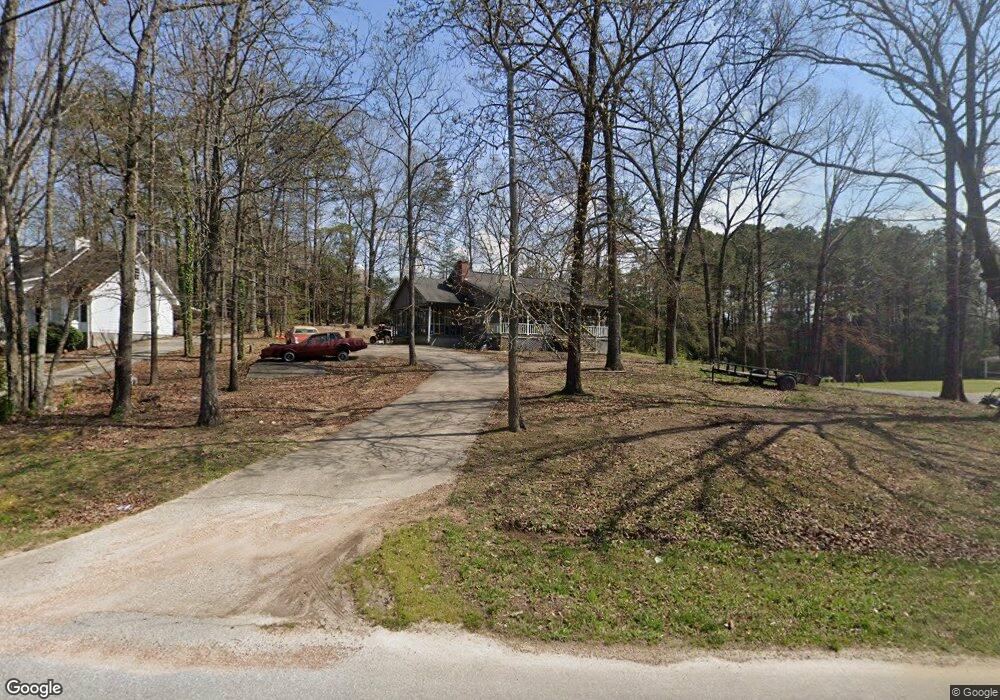
33 Main Line Rd Rockmart, GA 30153
Estimated Value: $220,550 - $268,000
3
Beds
2
Baths
1,564
Sq Ft
$155/Sq Ft
Est. Value
About This Home
This home is located at 33 Main Line Rd, Rockmart, GA 30153 and is currently estimated at $242,888, approximately $155 per square foot. 33 Main Line Rd is a home located in Polk County with nearby schools including Rockmart Middle School.
Ownership History
Date
Name
Owned For
Owner Type
Purchase Details
Closed on
Apr 1, 2002
Sold by
Thompson Karen
Bought by
Thompson Karen and Thompso Chadwick J
Current Estimated Value
Purchase Details
Closed on
Dec 21, 2001
Sold by
Smolen Jonathan
Bought by
Dantzler Alice I
Purchase Details
Closed on
Mar 8, 2001
Sold by
Secretary Of Housing & Urban Development
Bought by
Dt Properties Inc
Purchase Details
Closed on
Jun 6, 2000
Sold by
National City Mortgage Co (Att-In-Fact*
Bought by
National City Mortgage Co
Purchase Details
Closed on
Aug 16, 1999
Sold by
Wilkes Brian L*
Bought by
Wilkes Donna M
Purchase Details
Closed on
Nov 11, 1998
Sold by
Beech Richard F and Beech Pamela R
Bought by
Wilkes Brian L and Wilkes Donna M
Purchase Details
Closed on
Jul 1, 1993
Sold by
Williams Joel M
Bought by
Beech Richard F
Purchase Details
Closed on
Apr 20, 1987
Sold by
Plant W Frank
Bought by
Williams Joel M
Purchase Details
Closed on
Jul 22, 1986
Bought by
Plant W Frank
Create a Home Valuation Report for This Property
The Home Valuation Report is an in-depth analysis detailing your home's value as well as a comparison with similar homes in the area
Home Values in the Area
Average Home Value in this Area
Purchase History
| Date | Buyer | Sale Price | Title Company |
|---|---|---|---|
| Thompson Karen | -- | -- | |
| Thompson Karen | $84,900 | -- | |
| Smolen Jonathan | -- | -- | |
| Dantzler Alice I | -- | -- | |
| Dt Properties Inc | -- | -- | |
| National City Mortgage Co | -- | -- | |
| Secretary Of The Department Of Housing&* | -- | -- | |
| Wilkes Donna M | -- | -- | |
| Wilkes Brian L | $85,500 | -- | |
| Beech Richard F | $63,000 | -- | |
| Williams Joel M | $56,900 | -- | |
| Plant W Frank | -- | -- |
Source: Public Records
Tax History Compared to Growth
Tax History
| Year | Tax Paid | Tax Assessment Tax Assessment Total Assessment is a certain percentage of the fair market value that is determined by local assessors to be the total taxable value of land and additions on the property. | Land | Improvement |
|---|---|---|---|---|
| 2024 | $1,513 | $74,384 | $8,000 | $66,384 |
| 2023 | $1,122 | $49,270 | $8,000 | $41,270 |
| 2022 | $866 | $38,472 | $3,400 | $35,072 |
| 2021 | $877 | $38,472 | $3,400 | $35,072 |
| 2020 | $879 | $38,472 | $3,400 | $35,072 |
| 2019 | $1,024 | $40,146 | $4,800 | $35,346 |
| 2018 | $1,021 | $39,050 | $4,800 | $34,250 |
| 2017 | $1,008 | $39,050 | $4,800 | $34,250 |
| 2016 | $1,008 | $39,050 | $4,800 | $34,250 |
| 2015 | $1,022 | $39,449 | $4,800 | $34,649 |
| 2014 | $964 | $37,049 | $2,400 | $34,649 |
Source: Public Records
Map
Nearby Homes
- 11 Lee St
- 107 Main Line Rd
- 92 Autumn Path
- 0 Pine Mountain St Unit 10620510
- 0 Pine Mountain St Unit 10620492
- 318 Morgan Valley Rd
- 1 Pine Mountain Rd
- 1714 Cedartown Hwy
- 18 Hillside Dr
- 865 Morgan Valley Rd
- 847 Polk St
- 740 Calloway Dr
- 702 Calloway Dr
- 1825 Calloway Path
- 278 Oak Hill Dr
- 750 W Church St
- 184 Morgan Ln
- 155 Government Farm Rd
- 831 Government Farm Rd
- 300 Church St
- 21 Main Line Rd
- 0 Main Line Rd Unit 8801820
- 0 Main Line Rd Unit 7601480
- 0 Main Line Rd Unit 7420175
- 29 Spur St
- 51 Main Line Rd
- 18 Spur St
- 36 Main Line Rd
- 20 Main Line Rd
- 50 Main Line Rd
- 31 Spur St
- 97 Old Cedartown Rd
- 59 Main Line Rd
- 87 Old Cedartown Rd
- 66 Main Line Rd
- 40 Lee St
- 71 Main Line Rd
- 50 Lee St
- 124 Old Cedartown Rd
- 134 Old Cedartown Rd